Factors Affecting World population
How has the world population grown?
|
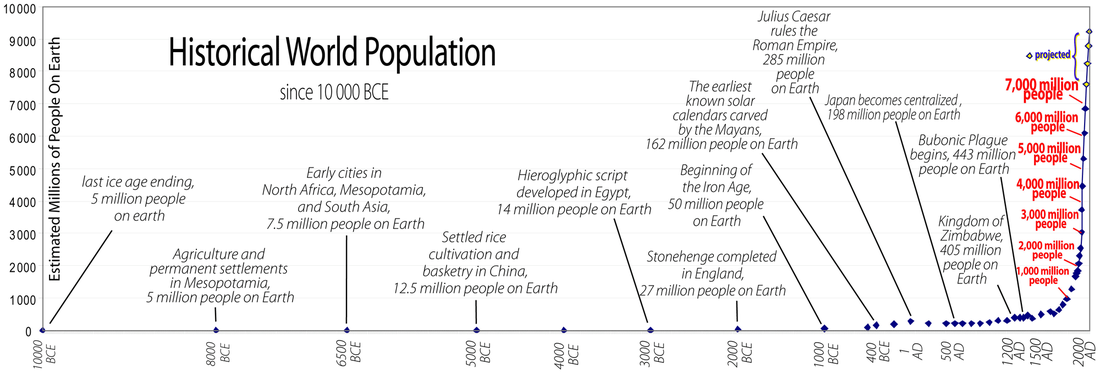
The pattern of the world's population growth has not been even over the last 10,000 years. Typically we can divide this growth into three distinct phases.
|
Using the button below explore the world's population using different dates.
|
|
|
|
|
Why has the world's population grown?
|
Research and Report:
We have just explored the pattern of world population growth but not why it has happened. To be able to answer this question you will have to do some research and discover some of the reasons. You will also need to critically review the reasons and using your own judgement and evidence evaluate these reasons. Use the evidence below and your own research to create a Report covering the following areas:
|
|
Read through and explore the links on the Population matters webpage
| ||||||
|
|
|
|
Practice question
|
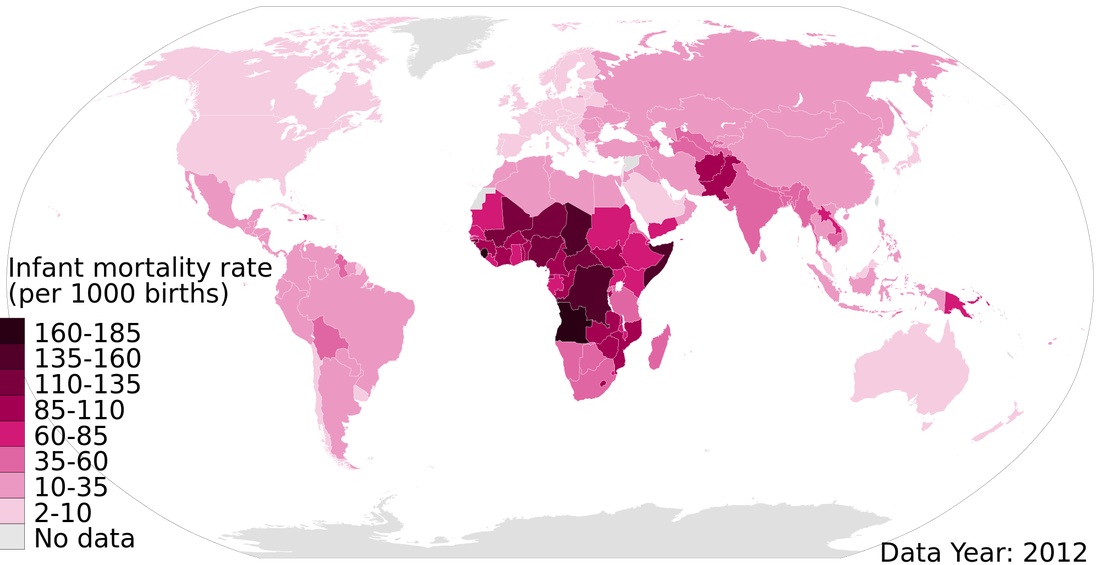
Describe the distribution of infant mortality in the world [4]
Examination Advice:
It is very typical in the IB Geography Examination for you to be asked to describe a map, graph or some form of data. These questions are usually worth 4 marks and to be able to score all marks you should.
|
Population pyramids
|
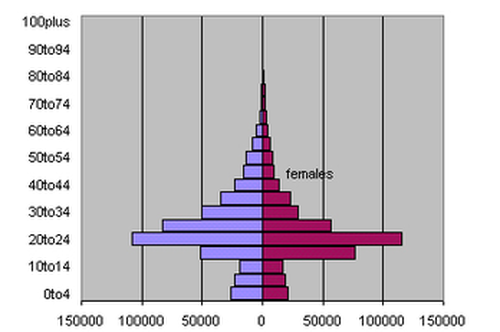
The structure of a population refers to the age and sex distribution of the population. This is often shown as a graph with the number or proportion of each age group shown as horizontal bars from a central vertical column that represents age groups. In general these graphs show males on the left hand side of the diagram and females to the right. These graphs are known as population pyramids, or age-sex diagrams.
Population pyramids reflect past and present demographic trends in the population being described. A population pyramid with a wide base that narrows quickly upwards represents a population with a high birth rate, a high proportion of young people and a rapidly growing population. A population pyramid with steep vertical sides represents an ageing population with a low birth rate. Such population pyramids typically have an excess of elderly females over males because females tend to have longer life expectancies than males. Countries with wide-based population pyramids have large numbers of children arising from a high fertility rate. As a result of the difference in population growth rates in industrialised and developing countries, a contrasting set of population structures has emerged. Developing countries tend to have population structures with a wide base, indicating that a large proportion of the population is below 15 years of age. This has important implications for future population growth in these nations as the young people Codrington, Stephen. Our Changing Planet (Planet Geography Book 1) (Kindle Locations 2155-2172). Solid Star Press. Kindle Edition. |
|
|
Analysing Population Pyramids
Key things to know about population pyramids
| ||||||
Population calculations
|
Dependency ratios
When a country has a declining population, as some countries in Europe are now experiencing, it places great strains on social security and pension funds. This is because an increasing proportion of the population become dependent on the wealth produced by a declining workforce. The dependency ratio attempts to quantify this impact. For the purposes of international comparisons, the economically active, or working, population is usually defined as those between the ages of 15 and 65 years of age. The dependent population is defined as those under 15 or over 65 years of age. The dependency ratio can therefore be calculated using the formula: Number of dependent people x 100 Number of people of working age In Australia, the calculation using 2016 figures would be as follows: Total population size = 24,090,325 people Percentage of people under 15 years = 19% Percentage of people 15 to 65 years = 66% Percentage of people over 65 years = 15% Therefore the number of people within the dependent age range was (19 + 15)% of 24.1 million, or 8,194,000 people (rounded off to 8.2 million). The number of working age people was 66% of 24.1 million, or 15,906,000 people (rounded off to 15.9 million). Therefore, Australia’s dependency ratio was: (8.2 x 100)/ 15.9 or 51.6%. This means that for every 100 people of working age, there were 48.4 people dependent on them. Back in 1975, Australia’s dependency ratio had been 57%, so although the proportion of elderly people has increased since 1975, it has been more than offset by a decline in the proportion of school-age children. Codrington, Stephen. Our Changing Planet (Planet Geography Book 1) (Kindle Locations 2338-2357). Solid Star Press. Kindle Edition. |
|
Population momentum and Doubling time
Population momentum refers to the lag period before the rate of natural increase or decrease affects population growth. This happens because children who have already been born but not reached childbearing age will continue to grow the population until the overall trend evens out.
We can calculate this Population Momentum Factor (PMF) by multiplying the crude birth rate (CBR) with the average life expectancy at birth (LEB). If the PMF is 1 this indicates that natural increase is not affecting the population growth. If PMF is greater than one then there is a positive momentum and this will lead to the future growth that we explained at the beginning. A PMF of less than 1 means a negative momentum and probably a decline in population size.
Another simpler way to look at growth is doubling time, or the amount of time it would take for a population to double in size. To calculate doubling time, we use the rule of 70, which is to divide the number 70 by the population growth rate expressed as a percentage.
dt = 70 / r
where dt is doubling time and r is the rate of population growth. Applying this formula, the population of a country with an annual growth rate of 2% would double every 35 years (70/2). A population growth rate of 0.1% per annum would take 700 years to double its population size (70/0.1). If a country has a negative rate of population change, then the formula will give the halving time for the population (or the number of years it will take for the population size to reduce to 50% of its present number.
Detailed examples of countries
|
For your IB you will need to use real life examples of countries and data to exemplify your responses. To do this you will need to create a Fact-file for two countries.
|
Megacities
|
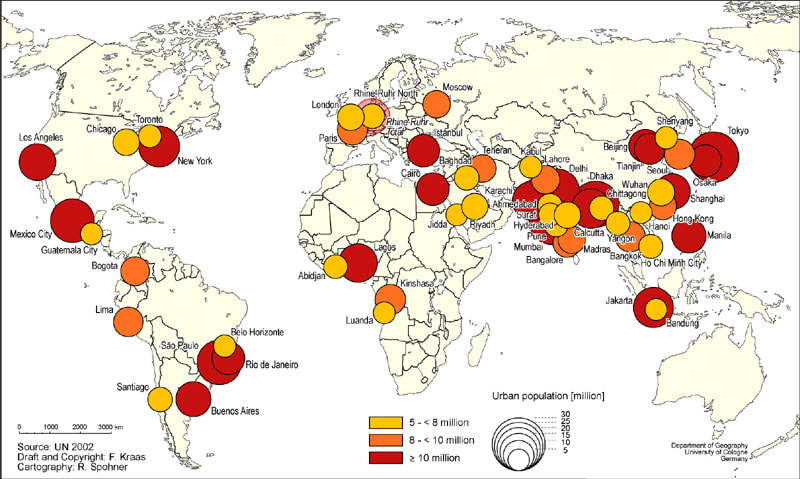
In 1975, just three of the world's urban centers — Tokyo, New York, and Mexico City — had more than 10 million residents.
Now, about 7% of people live in cities with eight-figure populations, according to the United Nations. They even have a special name: megacities. The UN projects the global number of megacities to grow from 31 to 41 by 2030, housing some 8.7% of the global population. Tokyo, Japan, is the largest city in the world with 38 million residents. That's about 12 million more people than New Delhi, India, the second-largest. Although Tokyo is projected to lose approximately 1 million residents by 2030, it's expected to remain the top megacity, according to the UN. But with rapidly increasing populations, many of these urban centers face major housing shortages. By 2025, 1.6 billion people could struggle to find decent housing that doesn't eat up more than 30% of their income, the standard measure of housing affordability, according to a report by McKinsey. Ultimately, there could be 106 million more low-income households in cities by 2025. |
EXTENDED viewing on Megacities
|
|
|
|
|
|
Shenzhen - Megacity
- Describe the location of Shenzhen, and explain why this location has been an important factor in the city’s growth.
- Why are Shenzhen’s official population statistics thought to under-estimate the real population size?
- What were the aims of the Chinese Government in establishing the Special Economic Zones in 1980?
- Describe the importance of in-migration as a factor in Shenzhen’s growth.
- Describe and account for the differences in Shenzhen’s age-sex structure compared with the typical population pyramids seen in developing and developed countries?
- Describe the master plan for Shenzhen’s development, being sure to mention (a) the hierarchical structure of urban centres, (b) the north-south transport axes, (c) the east-west development belts, (d) the green belts, and (e) the links with other large urban centres.
- Why does most housing in Shenzhen consist of high-rise residential blocks?
- Which challenges that are typical of most megacities are found in Shenzhen?
- Which problems found in most megacities are absent or of minor importance in Shenzhen?
|
Research links:
| |||||||
|
|
|
|
migration
Migration is the movement of people from one place to another. The reasons for migration can be economic, social, political or environmental. There are usually push factors and pull factors at work. Migration impacts on both the place left behind, and on the place where migrants settle.
- Internal migration is when people migrate within the same country or region - for example, moving from London to Plymouth.
- International migration is when people migrate from one country to another - for example, moving from Mexico to the USA.
- Emigration - when someone leaves a country.
- Immigration - when someone enters a country.
|
|
|
|
Discuss and explore some of the migrations patterns in the world. Consider why they exist and the possible factors that could have caused this movement of people.
A Basic Overview of Why People Migrate:
People migrate for many different reasons. These reasons can be classified as economic, social, political or environmental:
A refugee is someone who has left their home and does not have a new home to go to. Often refugees do not carry many possessions with them and do not have a clear idea of where they may finally settle.
People migrate for many different reasons. These reasons can be classified as economic, social, political or environmental:
- economic migration - moving to find work or follow a particular career path
- social migration - moving somewhere for a better quality of life or to be closer to family or friends
- political migration - moving to escape political persecution or war
- environmental causes of migration include natural disasters such as flooding
A refugee is someone who has left their home and does not have a new home to go to. Often refugees do not carry many possessions with them and do not have a clear idea of where they may finally settle.
|
Pull factors are the reasons why people move to a particular area. They include:
|
Push factors are the reasons why people leave an area. They include:
|
| Migration Models | |
| File Size: | 1058 kb |
| File Type: | pptx |
Forced Migration
What is Forced Migration?
Forced Migration is “a general term that refers to the movements of refugees and internally displaced people (those displaced by conflicts within their country of origin) as well as people displaced by natural or environmental disasters, chemical or nuclear disasters, famine, or development projects.”
There are many causes of displacement. Some of the more common include:
Conflict-Induced Displacement occurs when people are forced to flee their homes as a result of armed conflict including civil war, generalized violence, and persecution on the grounds of nationality, race, religion, political opinion or social group.
Development-Induced Displacement occurs when people are compelled to move as a result of policies and projects implemented to advance ‘development’ efforts. Examples of this include large-scale infrastructure projects such as dams, roads, ports, airports; urban clearance initiatives; mining and deforestation; and the introduction of conservation parks/reserves and biosphere projects.
Disaster-Induced Displacement occurs when people are displaced as a result of natural disasters (floods, volcanoes, landslides, earthquakes), environmental change (deforestation, desertification, land degradation, global warming) and human-made disasters (industrial accidents, radioactivity).
Syria
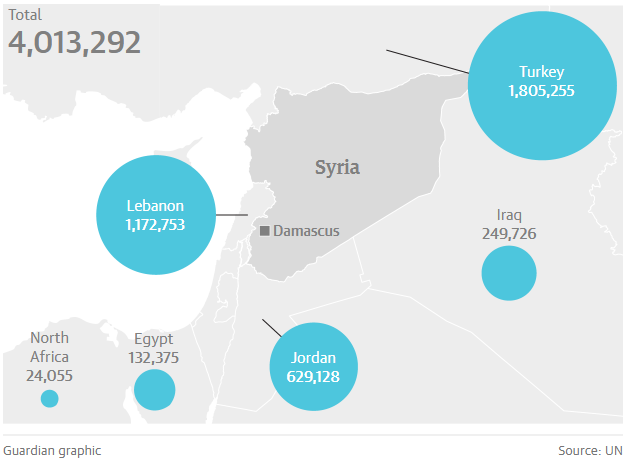
The conflict in Syria has now driven more than four million people – a sixth of the population – to seek sanctuary in neighbouring countries, making it the largest refugee crisis for a quarter of a century, according to the UN.
On Thursday, the UN refugee agency, UNHCR, said the total number of Syrian refugees in Turkey, Lebanon, Iraq, Jordan, Egypt and other parts of north Africa stood at 4,013,000 people.
With at least 7.6 million people forced from their homes within Syria, almost half the country’s people are either refugees or internally displaced. The conflict, now in its fifth year, has killed more than 220,000 people.
|
|
|
|
|
|
|
|
|
|
|
