Please help keep the Geographer Online a FREE resource
Disparities in wealth and development
Index
Measurements of Region and Global Disparities

Project/Awareness:
Poverty in our local community.
This could involve a variety of different projects ranging from surveys, to food collections, working in 'soup' kitchens to increasing awareness by presentations/project. It could link art and photography, by maybe taking photos of volunteer working etc. Local organisations include: “Restos du Coeur” or “Les anges de Monaco”
Key terms
|
|

Infant mortality rate
Make notes on the causes of infant mortality rate and describe the global trend.
Make notes on the causes of infant mortality rate and describe the global trend.
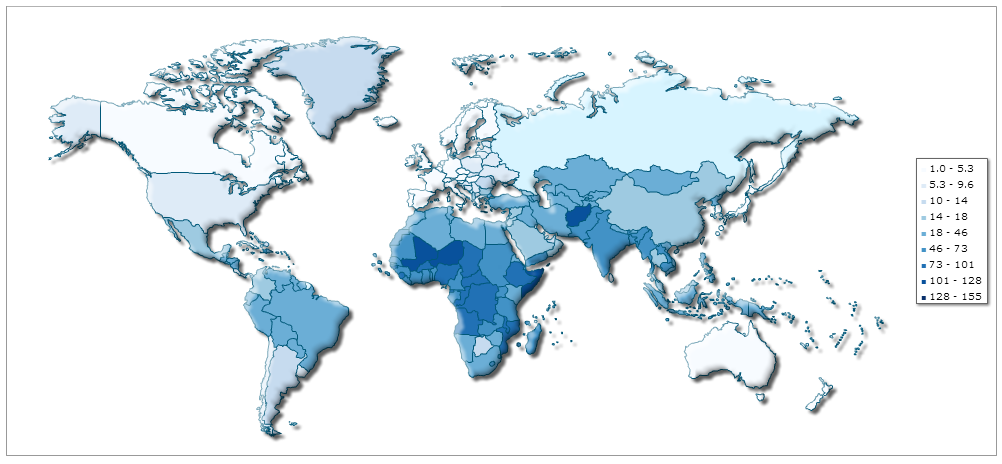
Interactive map
The most common causes of death in children under-five are:
|
It is hard to establish accurate figures for newborn mortality rates because many early deaths go unreported or are wrongly classified, so these statistics are an estimation.Neonatal mortality has been declining worldwide. The number of deaths among babies in the first 28 days of life decreased from 4.4 million in 1990 to 3.1 million in 2010.
There was also a 28% reduction in newborn mortality rates (NMRs) over the same period of time, from an estimated 32 deaths per 1,000 live births to 23 deaths per 1,000 live births. But progress is slow and unequal in different countries.
Compare infant mortality rates on GapMinder |
Education
Education is the key to socio-economic development. It is one of the components of the HDI and examines:
Female education is one of the World Bank's largest aims and the UN sees education as the vital in its efforts of achieving sustainable development.
Discuss the following two sets of data. What patterns can you see in the world?
Education is the key to socio-economic development. It is one of the components of the HDI and examines:
- adult literacy
- school enrolment
Female education is one of the World Bank's largest aims and the UN sees education as the vital in its efforts of achieving sustainable development.
Discuss the following two sets of data. What patterns can you see in the world?
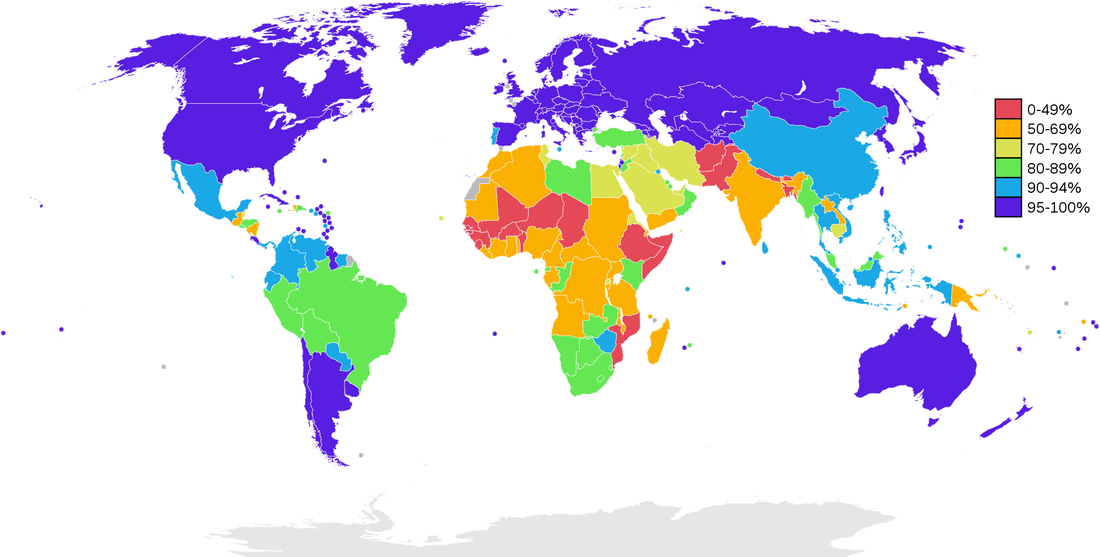
World literacy rates
|
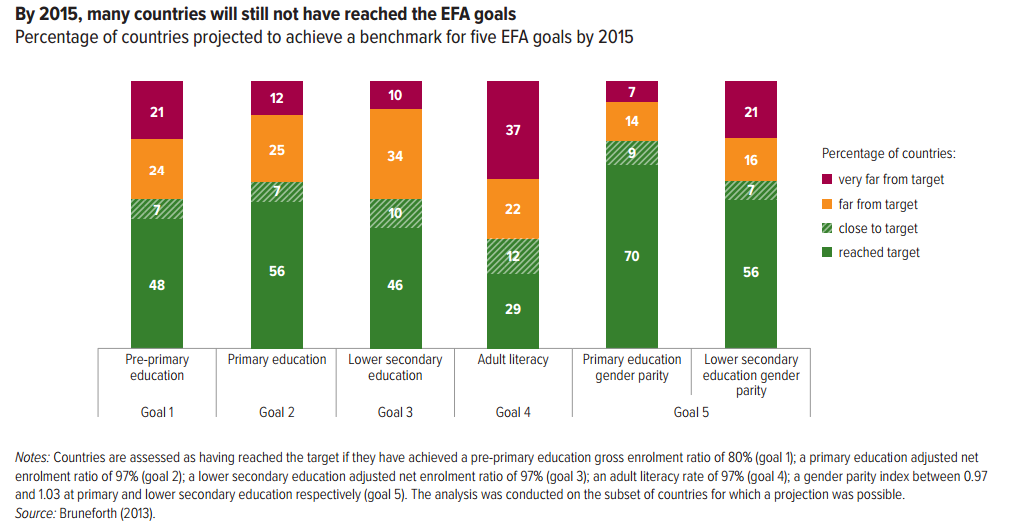
The Education For ALL (EFA) Development Index (EDI) is a composite index using four of the six EFA goals
|
Nutrition
Nourishment is an important indicator because it can affect peoples ability to work, get educated and fight disease. Again the elimination of hunger is a Millennium Development Goal (number one). The leading cause of death in children in developing countries is protein-energy malnutrition. In the most recent global recession UN studies show that:
- The hours of work needed to feed a family of five increased by 10-20%
- 50 million women or 40% of pregnant women in developing countries are anemic.
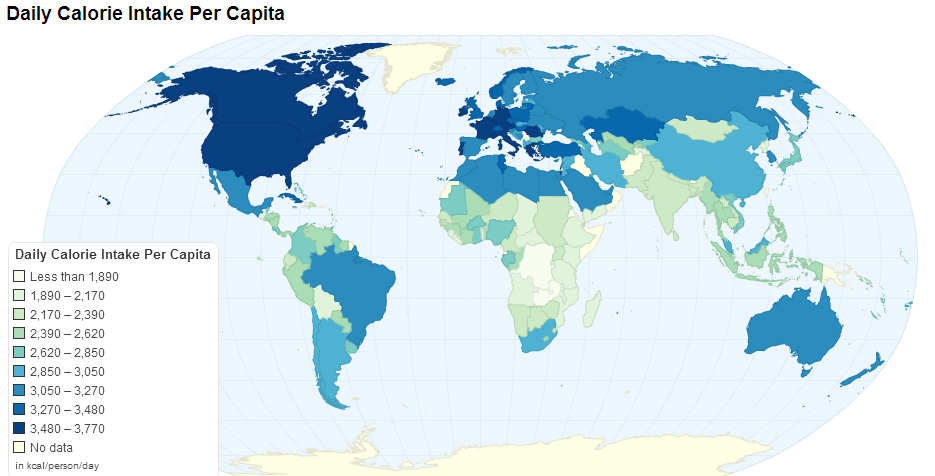
Daily Calorie Intake per capita
|
World bank data on the precentage of population that is undernourished per country.
|
|
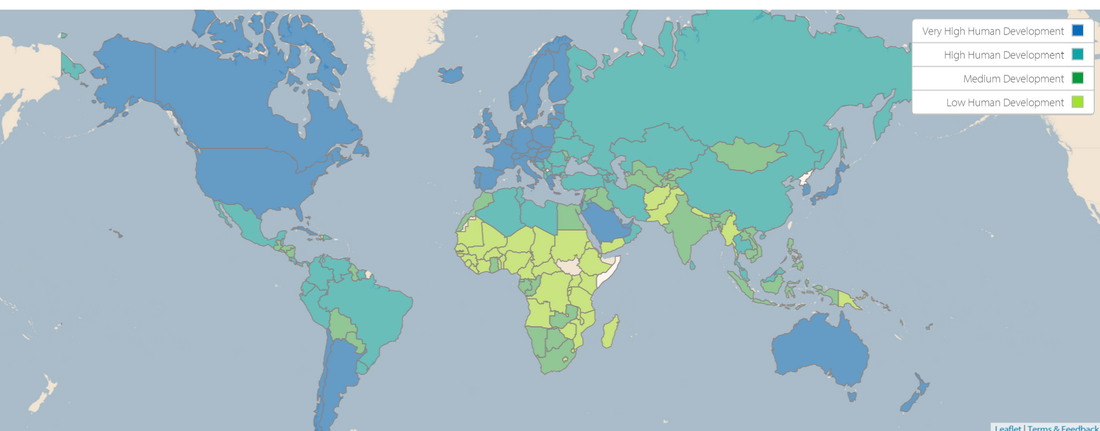
Human Development Index (HDI)
Human development index (HDI): HDI was developed in 1990 and is used by the United Nations to measure levels of development, HDI looks at three variables:
The HDI calculations score all countries between 0 and 1. The map below shows that according to HDI the most developed countries are in Western Europe North America and Australia while the least developed countries are in Central Africa. HDI is what is known as a composite measure. This simply mean that more than one variable is taken into account, for HDI three variables are looked at. It can be harder to collect all the data for composite measures, but they do give a more complete and accurate picture of a country's are area's development. Examine the HDI data from the UNPD Compare the graphs and describe the distribution on the map. |
|
Problems and Limitations of Development Indicators
Although development indicators can be useful for governments, NGO's etc. to know where to target investment or where for industries to locate a new factory, or even for where an individual to move to, they do have their limitation. These limitations include:
Although development indicators can be useful for governments, NGO's etc. to know where to target investment or where for industries to locate a new factory, or even for where an individual to move to, they do have their limitation. These limitations include:
- Countrywide statistics disguise intra-country variations. For example if you look at the map below, the east of China is a lot richer than the west, but if you looked at China's overall GDP you would not know this.
- In many countries data is inaccurate or incomplete. Some countries also refuse to release certain pieces of information or data.
- Most development indicators (with the exception of HDI) focus on only one aspect of development.
- Most indicators use averages and tend to neglect or highlight the sectors of the population that are marginalised.
- Indicators are always out of date. Once information has been collected, analysed, presented and published a lot of things can have changed either for the better or worse.
- Development indicators can be manipulated, used or ignored to suit peoples needs. One indicator may suggest an area is developed while another may suggest an area is undeveloped.

Project:Define and examine the spatial distribution of indices of infant mortality, education, nutrition, income and HDI. Explain what these indexes show.
The task is to make a YouTube or a short video (maximum 5 min) examining the five sets of data and looking at their world distribution and discussing it.
To find interactive maps to discuss you can use:
How you create this you will need to screen capture the interactive map as you navigate around it and then record audio explaining what we can see and give a few reasons why.
There are many methods to accomplish this.
- Windows : LiteCam
- Mac : Screen recorder using QuickTime player
|
|
|
Origin of Disparities
Key Terms
|
|
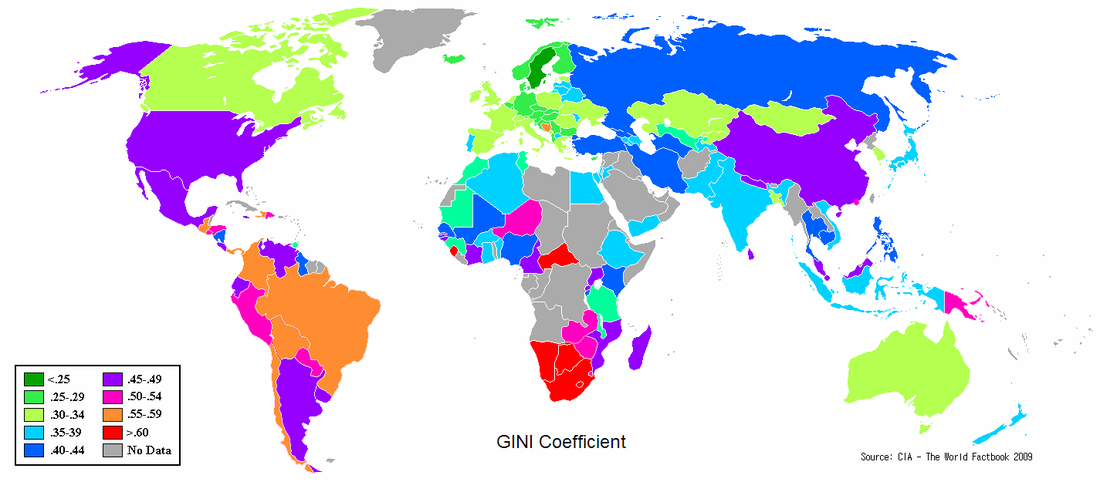
Look at the maps below and describe the distribution of incomes in the world
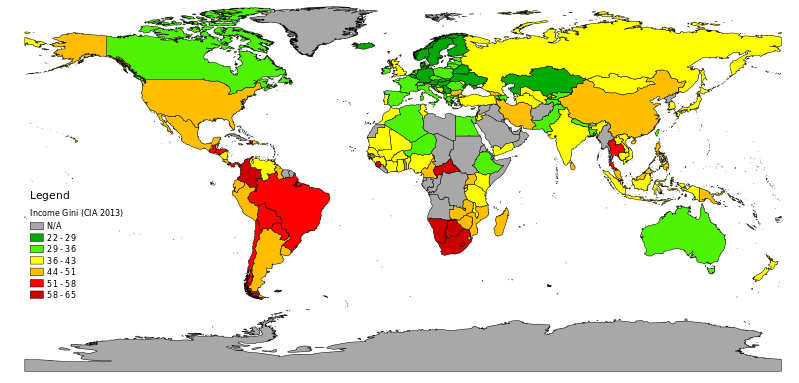
Gini Coefficient 2013
|
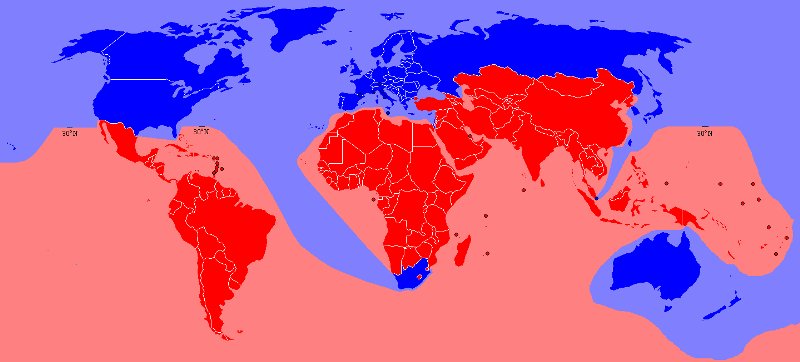
The Brandt line
|

Poverty Cycle
Parental Education
Read through the BBC article on education and the the Global Post Article discuss and make some notes on how it can impact disparities.
Read through the BBC article on education and the the Global Post Article discuss and make some notes on how it can impact disparities.

Project: Zimbabwe
Your Task is to create a presentation on how there are disparities and inequalities in Zimbabwe. You will need to find information on the disparities caused by:
- Ethnicity
- Residence
- Income
- Employment
- Land Ownership
- Parental education
|
Part 1:
|
|
Part 2: Ethnicity
|
|
|
Part 3: Residence and Land Ownership
YouTube from 1998 before the Land Reform Policy of 2000 |
Resources:
YouTube from 2013 indicating that Zimbabwe has started to recover. |
|
Part 4: Disparity in Income and Employment
|
|
Part 5: Conclusion
|

Example Available
Disparities and Change
Key Terms
|
|

|
Print presentation and make notes on how countries have developed and how this has influenced global disparities.
|
| development_theories.ppt |
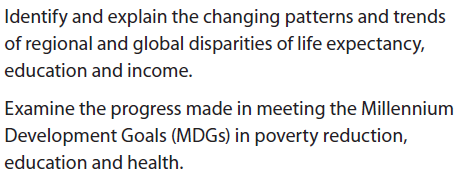
Life Expectancy Patterns
Historical life expectancy
|
What can increase life expectancy?
|
Discuss the changes in life expectancy in France since the 1800s
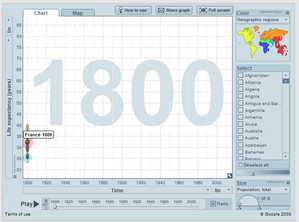
Gapminder link
|

Global life expecatncy
Income patterns
|
Gini index measures the extent to which the distribution of income or consumption expenditure among individuals or households within an economy deviates from a perfectly equal distribution. A Lorenz curve plots the cumulative percentages of total income received against the cumulative number of recipients, starting with the poorest individual or household. The Gini index measures the area between the Lorenz curve and a hypothetical line of absolute equality, expressed as a percentage of the maximum area under the line. Thus a Gini index of 0 represents perfect equality, while an index of 1 implies perfect inequality (sometimes this will be converted into a score out of 100).
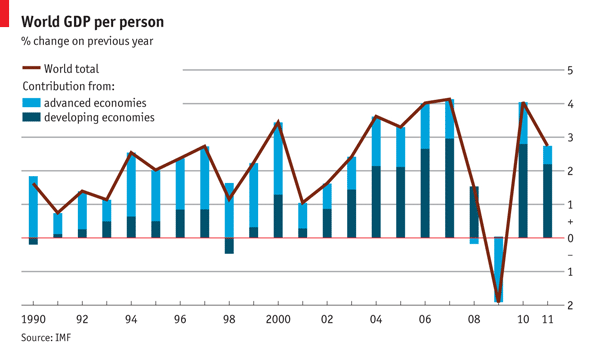
World GDP per person
|
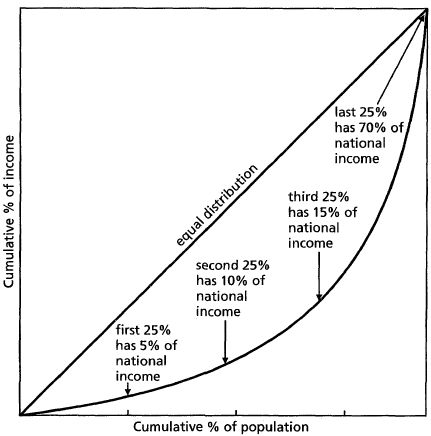
Lorenz Curve
World Gini Coefficient
|
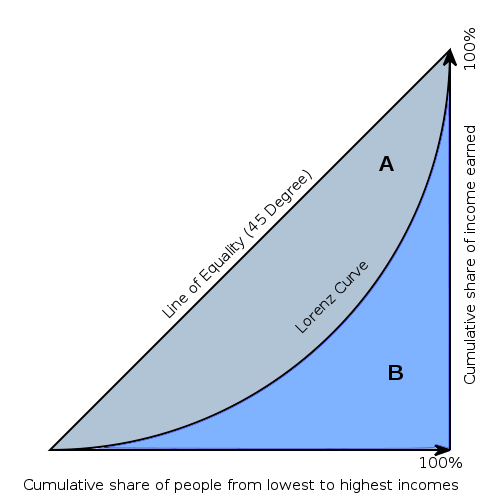
What does the Gini coefficient graph mean?
Lorenz Curve
The graph shows that the Gini coefficient is equal to the area marked A divided by the sum of the areas markedA and B. that is, Gini = A / (A + B). It is also equal to 2*Adue to the fact that A + B = 0.5 (since the axes scale from 0 to 1).
Education Patterns
|
Ways education can be measured:
|
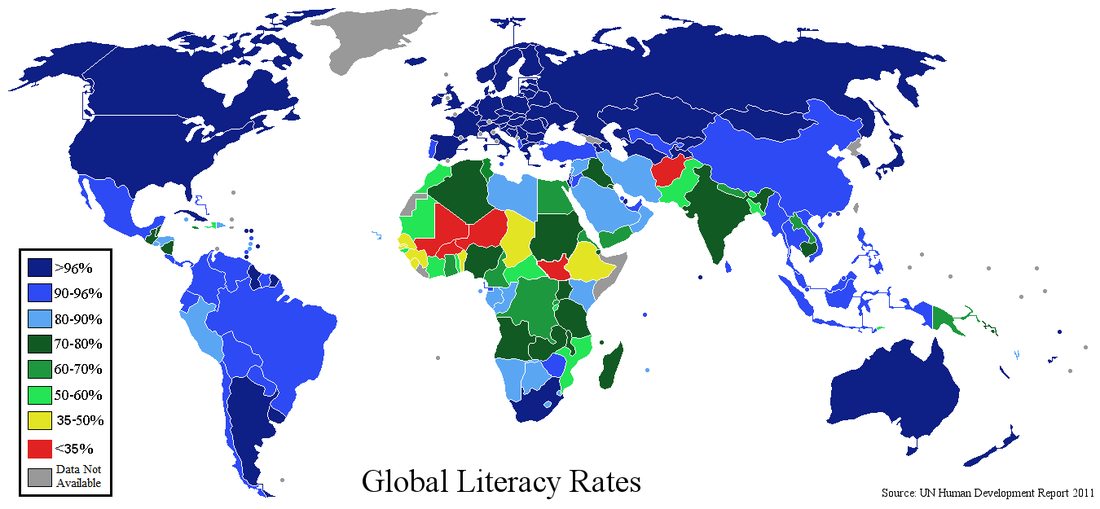
World literacy rates 2011
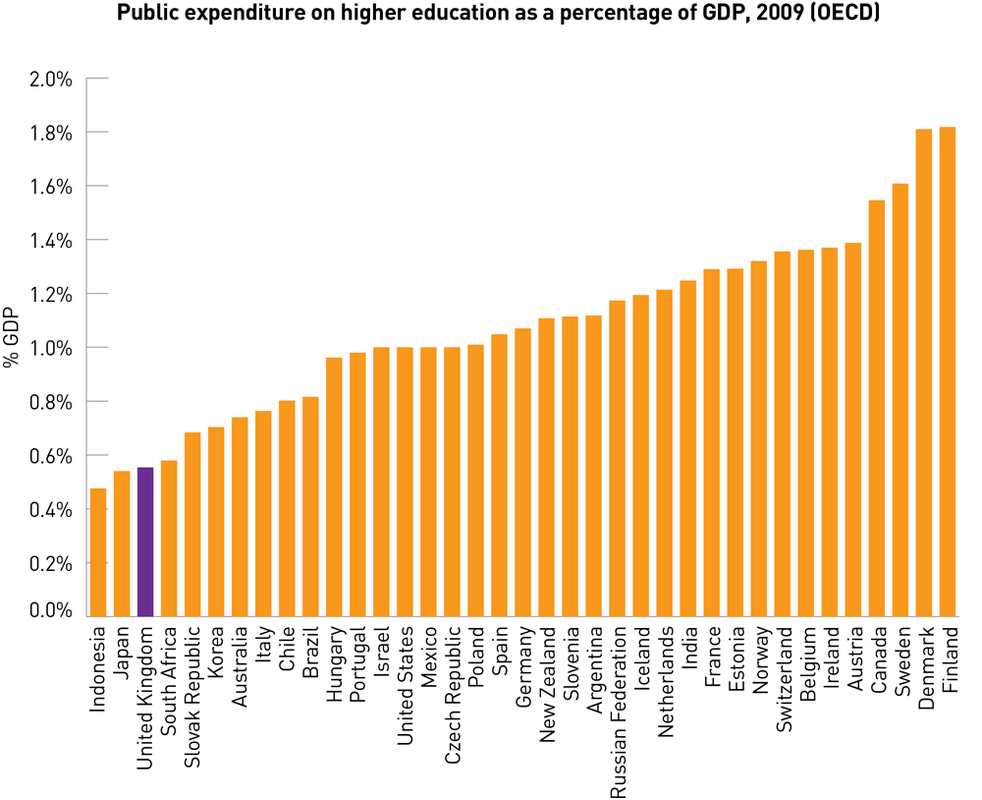
Public spending on education as a % of GDP
|
Millennium development goals
The Millennium Development Goals (MDGs) were established following the Millennium Summit of the United Nations in 2000, following the adoption of the United Nations Millennium Declaration. All 189 United Nations member states at the time committed to help achieve the Millennium Development Goals by 2015.
|
1. Eradicate extreme poverty and hunger
2. Achieve universal primary education
3. Promote gender equality and empower women
4. Reduce child mortality rates
5. Improve maternal health
6. Combat HIV/AIDS, malaria, and other diseases
|
7. Ensure environmental sustainability
Develop a global partnership for development
|
MDG progress.
| the_millennium_development_goals.pptx |
| 2013_progress_english.pdf |
Plan and answer the IB Style Question:
Assess the extent that there has been uneven progress in meeting the Millennium Development Goals [15]
Assess the extent that there has been uneven progress in meeting the Millennium Development Goals [15]
To do this you will need to make some notes on the 3 Goals we need to assess: Poverty Reduction, Education and Health
- For each you should explain what the main goal is with its subsections
- Where and to what degree will the targets be met?
- Which targets have not been met and why?
- What factors have made this target difficult to achieve?
- Give named examples of these.
The information below should help you with the task
Poverty Reduction - Goal 1
|
Look at the PDF document above and note down how successful they are and in which region. |
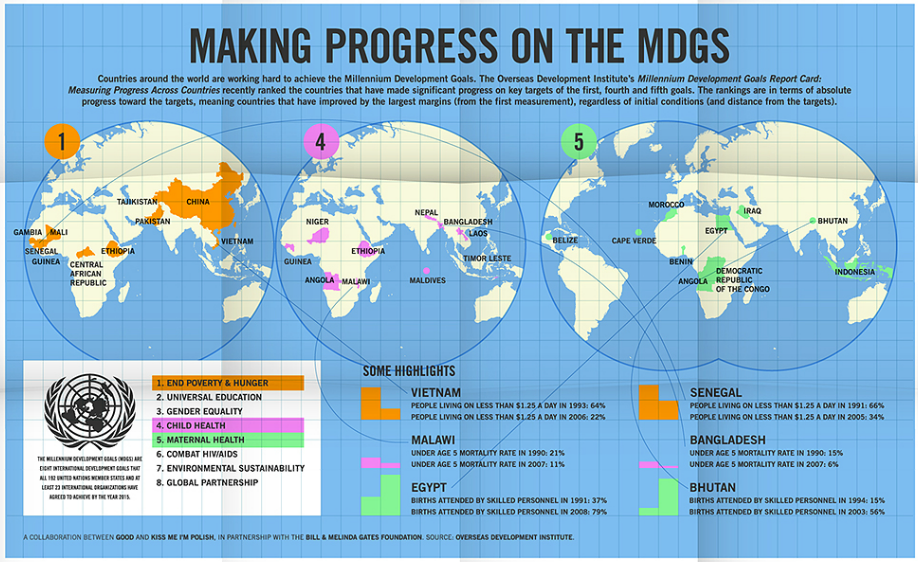
Progress in poverty reduction
|
|
Improvement in Education - Goal 2
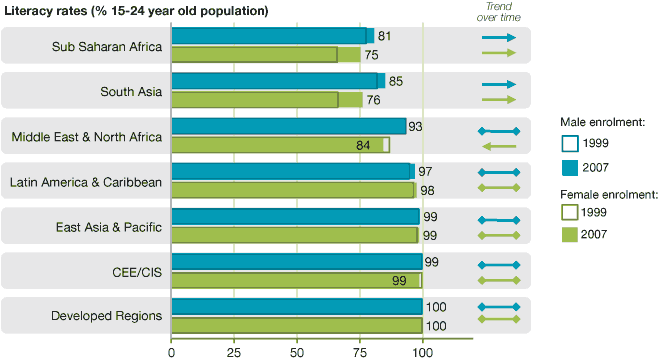
Changes in childrens' literacy rates
|
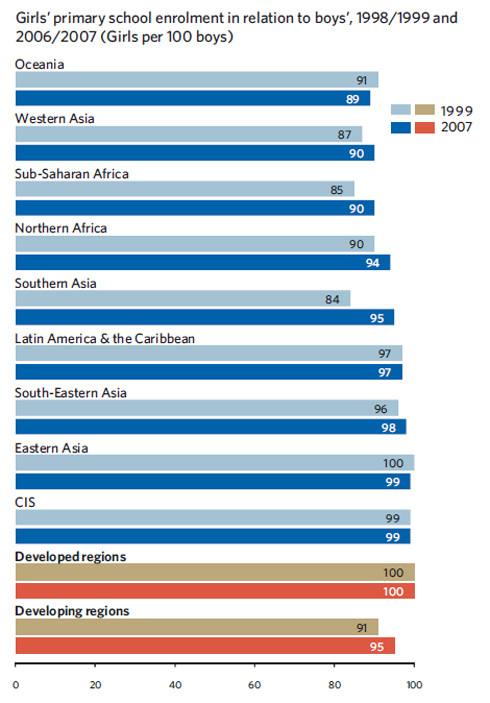
Comparing Boys and Girls in Education
|
|
Improvements in Health - Goal 4, 5 & 6
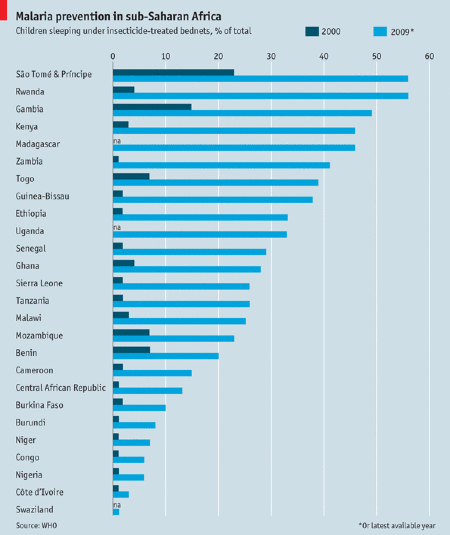
Malaria Prevention in sub-Saharan Africa
|
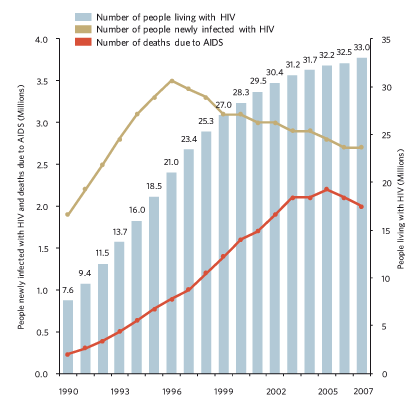
Trends in HIV
|
General MDG overviews
Watch the two following YouTubes and sites to make notes on the varied regional successes of the MDGs and why certain areas are not meeting the goals.
Debate the overall level of success in meeting the MDGs.
Watch the two following YouTubes and sites to make notes on the varied regional successes of the MDGs and why certain areas are not meeting the goals.
Debate the overall level of success in meeting the MDGs.
|
|
|
|
Info-graphic link to Africa and MDG progress
Reducing Disparities
Key Terms
|
|
Research Project/Awareness:
Fair trade - an examination of where the foods served in the school canteen originate from. This covers concepts also in HL Geography such as Food miles and glocalisation. The project could involve an awareness campaign aimed at the middle school (you could create a Youtube for example). It could also be included as part of a 'bake sale' using fair trade products, the funding of which could later be used for other CAS projects.
Group task:
This will be a collaborate assignement where you will work in groups (or individually) to meet the IB requirements in the four necessary areas:
Your task is to create a detailed presentation for the rest of the class.
This will be a collaborate assignement where you will work in groups (or individually) to meet the IB requirements in the four necessary areas:
- Trade and market access
- Dept relief
- Aid
- Remittances
Your task is to create a detailed presentation for the rest of the class.

Examples available
| criteria_for_marking_in_class_presentation_task.docx |
Group 1:
Reducing disparities - Trade and Market access
Reducing disparities - Trade and Market access
| Assignment guidance for Trade and Market Access |
Examine in general how trade and market access can be beneficial for reducing disparities. Watch the two YouTubes
Read:
Read:
- Patterns and Change book pg 124-128
- WTO on Free Trade
- http://news.bbc.co.uk/2/hi/business/4510792.stm#nafta
|
|
|
Case Study: FairTrade
www.fairtrade.org.uk
http://news.bbc.co.uk/2/hi/business/4788662.stm
http://www.fairtrade.org.uk/what_is_fairtrade/history.aspx
http://www.greenamerica.org/programs/fairtrade/products/bananas.cfm
http://www.globalissues.org/article/63/the-banana-trade-war
www.fairtrade.org.uk
http://news.bbc.co.uk/2/hi/business/4788662.stm
http://www.fairtrade.org.uk/what_is_fairtrade/history.aspx
http://www.greenamerica.org/programs/fairtrade/products/bananas.cfm
http://www.globalissues.org/article/63/the-banana-trade-war
|
|
|
Group 2:
Reducing Disparities - Debt Relief
Reducing Disparities - Debt Relief
| Assignment Guidance for Debt Relief |
Case Study: Live8

Group 3:
Reducing Disparities - Aid
Reducing Disparities - Aid
| Assignment Guidance for Aid |
|
| ||
Case Study: Haiti

| Assignment Guidance for Remittances |
|
Advantages of Remittances
|
Disadvantages of Remittances
|
|
|
|
Case Study: Africa
