Please help keep the Geographer Online a FREE resource
Fresh Water issues and conflicts
Index
The water system
Key Terms
|
|
The Hydrological cycle
The water cycle, also known as the hydrologic cycle or the H2O cycle, describes the continuous movement of water on, above and below the surface of the Earth. The mass of water on Earth remains fairly constant over time but the partitioning of the water into the major reservoirs of ice, fresh water, saline water and atmospheric water is variable depending on a wide range of climatic variables. The water moves from one reservoir to another, such as from river to ocean, or from the ocean to the atmosphere, by the physical processes of evaporation, condensation, precipitation, infiltration, runoff, and subsurface flow. In so doing, the water goes through different phases: liquid, solid (ice), and gas (vapor).
The water cycle involves the exchange of energy, which leads to temperature changes. For instance, when water evaporates, it takes up energy from its surroundings and cools the environment. When it condenses, it releases energy and warms the environment. These heat exchanges influence climate. The evaporative phase of the cycle purifies water which then replenishes the land with freshwater. The flow of liquid water and ice transports minerals across the globe. It is also involved in reshaping the geological features of the Earth, through processes including erosion and sedimentation. The water cycle is also essential for the maintenance of most life and ecosystems on the planet.
(Wikipedia Definition)

Complete the Water Cycle worksheet |
| ||
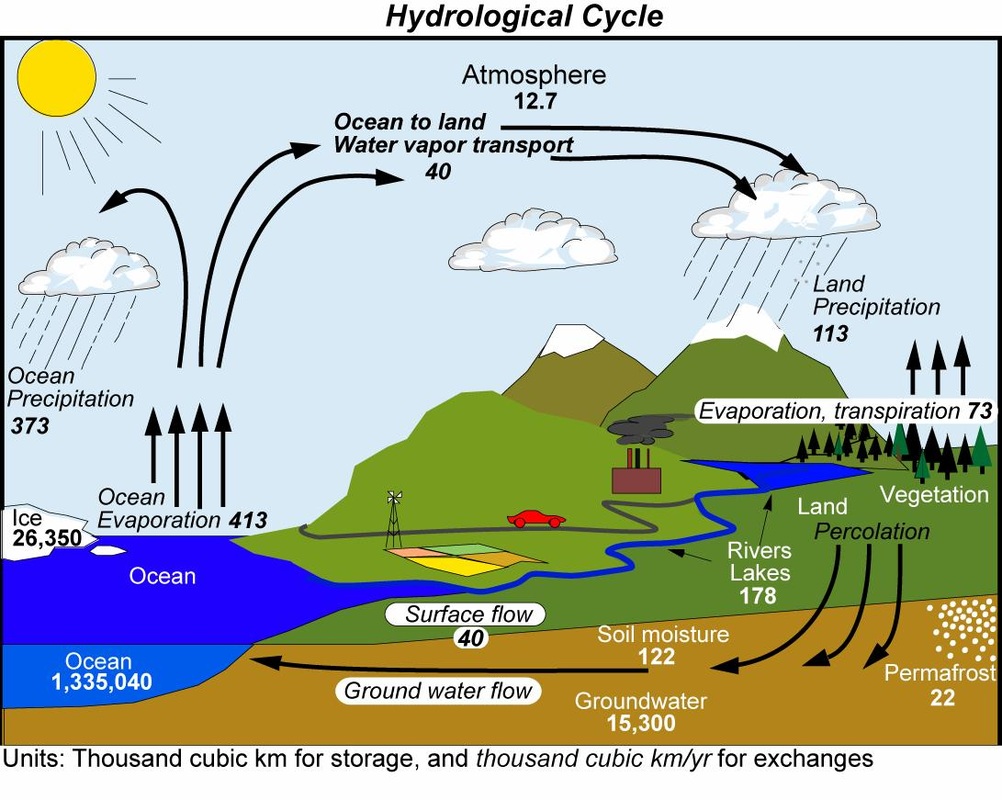
The Hydrological Cycle
|
|
|
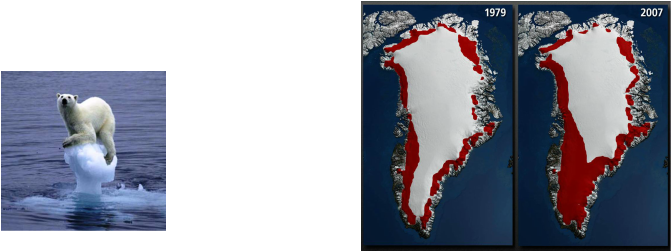
The changing balance of water
Due to rising global temperatures there are many concerns that there will be a change in balance in the Hydrological cycle. Melting ice caps along with the thermal expansion of the seas causing Eustatic and Isostatic changes on our planet.
Visit section in Oceans and Their Coastal Margins for Presentation on sea level changes.
Visit section in Oceans and Their Coastal Margins for Presentation on sea level changes.

Complete the 4 activities found on the this Link
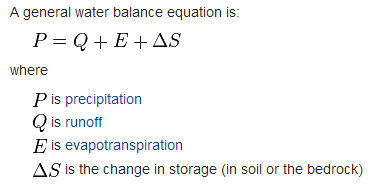
The Water Balance equation
|
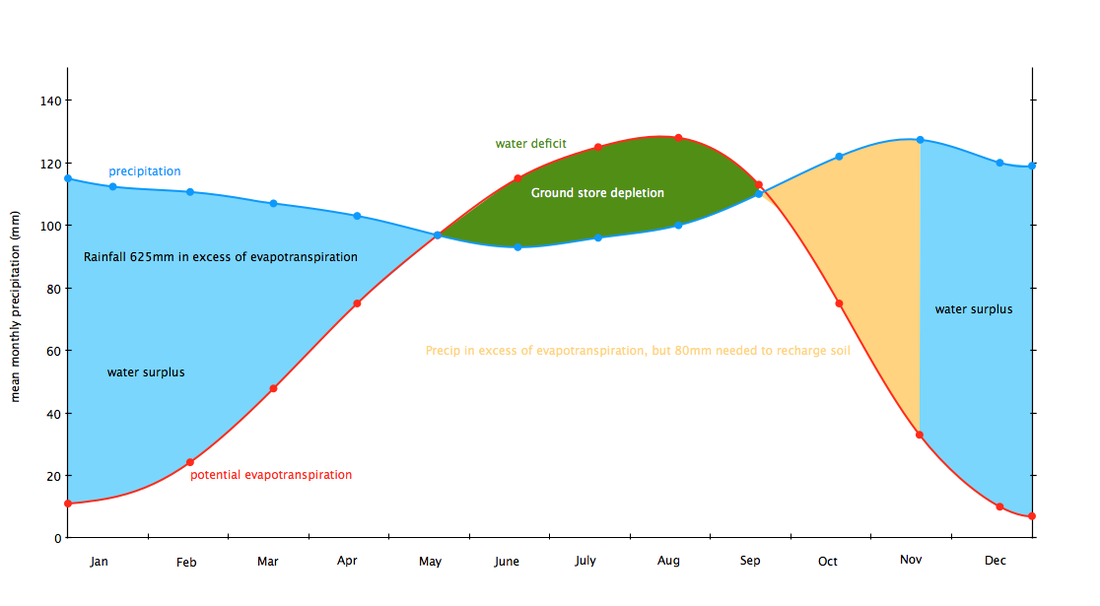
This interaction between run-off, evapotranspiration and storage is in constant change throughout the year and depends on both the characteristics of the physical environment and climate. The graph to the right shows a water budget for two distinct seasons. During the dry season there is a soil moisture deficit, caused by evapotranspiration exceeding precipitation.
|
Water Balance
|
|
|
|
Drainage basins and flooding
Key Terms
|
|
Drainage Basins

Draw a labeled diagram of a drainage basin. Define all the key terms. |
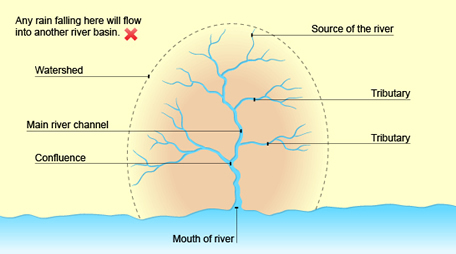
River drainage basin
|
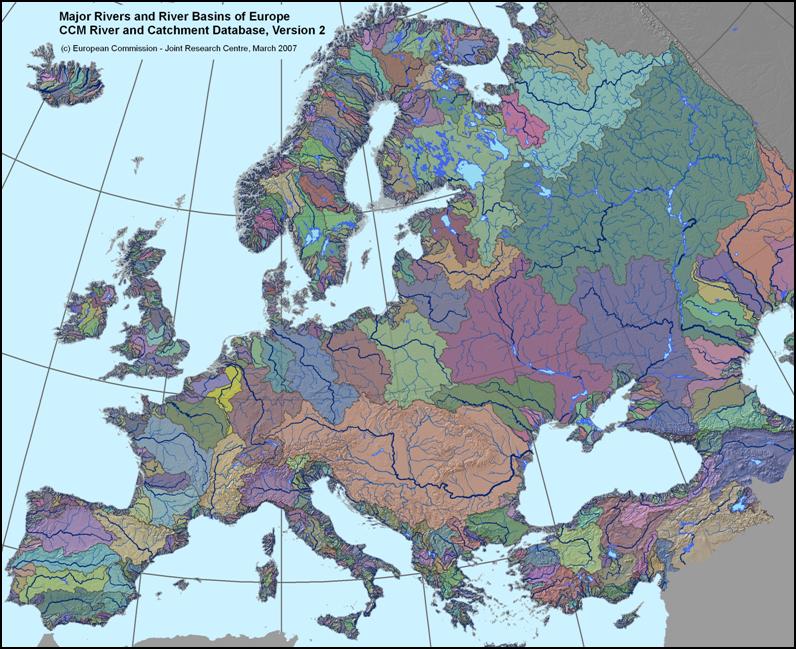
European drainage basins
|
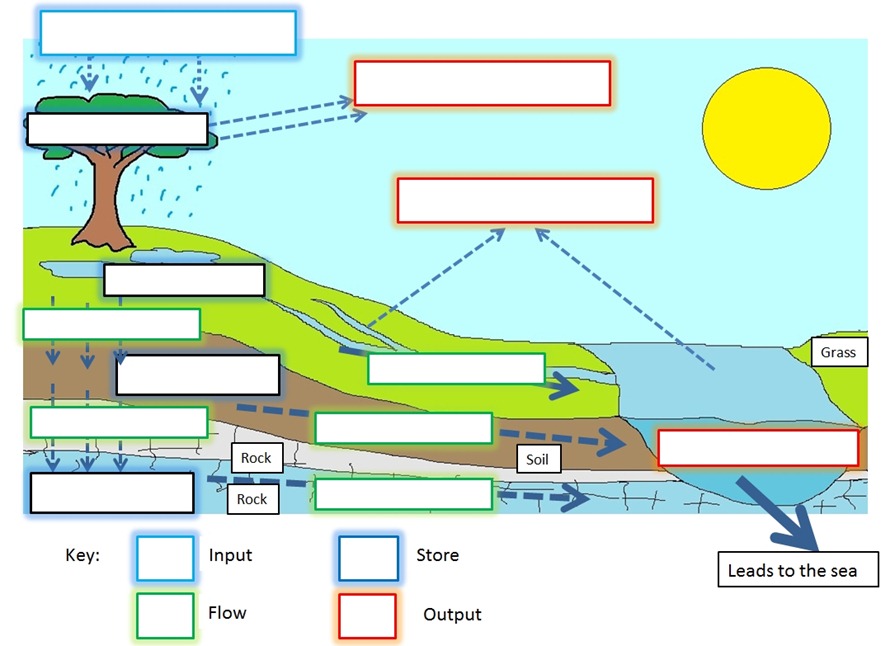
Inputs
The main input to the system is precipitation. The type of precipitation (rain or snow, etc), the intensity, the duration and frequency all have an effect on the amount of water in the system. Each subsystem of the drainage basin system will also have inputs and ouputs, and the output from one stage of the diagram will form the input for another. Transfer
The sum of all the water flowing over the drainage basin’s surface is called runoff. It is made up of streamflow, which is flow through permanent river channels and overland flow or surface runoff. Overland flow transfers water through the basin either as sheetwash, across the surface, or in tiny channels called rills. Beneath the surface, water is transferred via throughflow, which is the movement of water through the lower soil towards rivers, and groundwater flow. Groundwater flow is typically very slow. Water that has been intercepted by foliage may also be transferred, either directly as throughfall, or by running down branches and stems via stemflow. |
Storage
Water is stored in a drainage basin on the surface in lakes and channels or underground in the groundwater store. Water reaches the groundwater store via the processes of infiltration and percolation. During these processes, some water will be stored in the soil and rock. The amount of water stored will vary depending on the porosity of the soil and on the permeability of the rock. Water can also be temporarily stored via interception. This refers to the storage of water on leaf and plant stems. Dense foliage may result in little water reaching the ground, since it often evaporates from the leaves. Outputs
The final release of the water in a drainage basin is known as its output. Typically, rivers flowing into the sea will be the main output of a drainage basin. Some water will also be lost via evapotranspiration. This process refers to direct evaporation, and also to the extend that moisture lost from leaves will result in plants withdrawing water from the soil via their roots. |
River System

Print and label the river system diagram above.
|
| ||
River Profile
| geography-fluviallandforms-120422215809-phpapp01.pptx |
Discharge
|
In hydrology, discharge is the volume rate of water flow (velocity), which is transported through a given cross-sectional area.
Discharge is normally measured in cumecs (cubic metres a second). 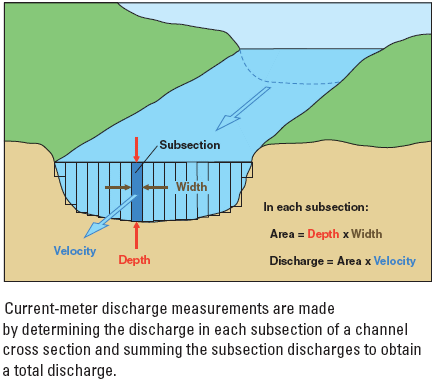
|
Bed: The bottom of the river channel
Banks: The sides of the river channel. Channel: The confines of the river, encompassing the bed and two banks. Wetted Perimeter: The total length of the bed and the banks in contact with the river. Cross-sectional area: The width of the river multiplied by the depth of the river. Because the depth of the river will vary across its width, an average depth reading is normally taken. The cross sectional area is normally given in m2. Velocity: This is the speed that the water in a river is travelling at. The unit of measurement is normally meters a second (m/s). River velocity can be measured using a flowmeter, |
| River Discharge and Storm Hydrographs |
| channel_efficiency.pptx |
The Bradshaw Model
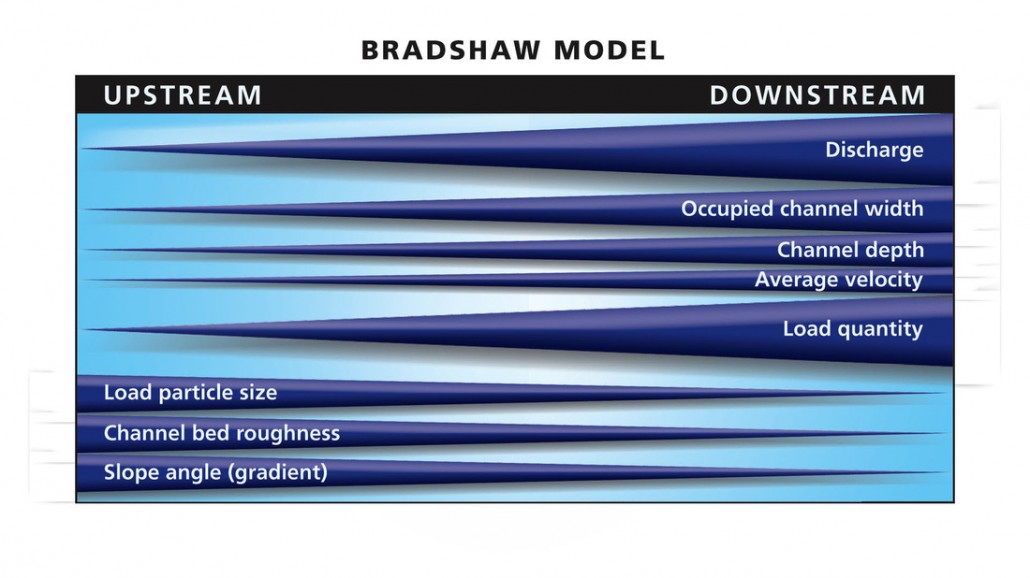
The Bradshaw Model

Annotate and explain the Bradshaw model. Why do the river characteristics change from upstream to downstream?
|
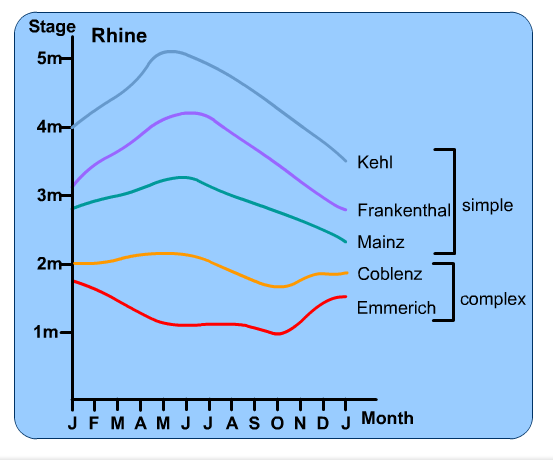
River Regimes
The regime of a river is expected to have a seasonal pattern of discharge during the year. This is due to factors such as climate, local geology and human interaction. Equatorial rivers have regular regimes but in the UK where seasons exist one or two peaks may be recognisable.
Simple regimes
These show times of high water levels followed by lower levels. They exist as a result of a glacier melt, Snowmelt, or seasonal rainfalls such as monsoons.
Complex regimes
If a river has more than one period of high water levels and/or low water levels, a more complex regime results. It is more common on large rivers that flow through a variety of relief and receive their water supply from large tributaries, for example, The Rhine.
River regimes
Storm Hydrographs
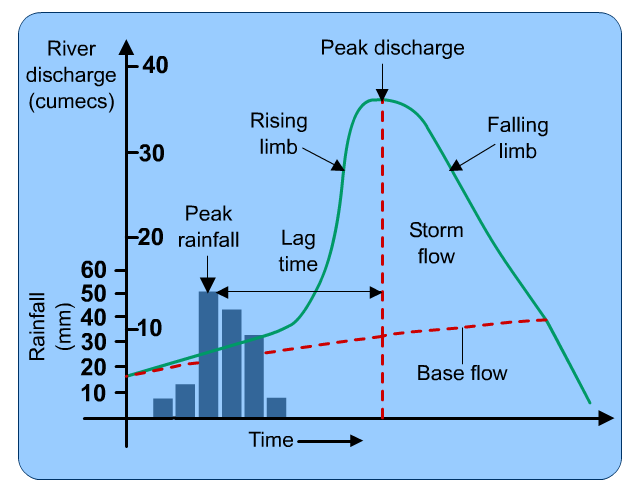
Storm Hydropgraph
|
|
| hydrographexplanationandanimation-110915140203-phpapp02.ppt |
Drainage basins all have a variety of characteristics in terms of vegetation, geology, soil type and so on, all of which interact to influence how quickly or slowly river discharge increases after a storm. Images A and B give an example of how a storm hydrograph can be impacted by the land around it.
|
A - Natural (forested)
|
B - Human (deforestation)
|

Project: Storm Hydrographs
To create a presentation (Powerpoint or Youtube) explaining and demonstrating how the characteristics of a drainage basin (human, soil, vegetation, shape, drainage density etc) affects a storm hydrograph). How can we use this to predict river flooding?
You will need to research this using your text book and the internet. Here are some potential sources of information:
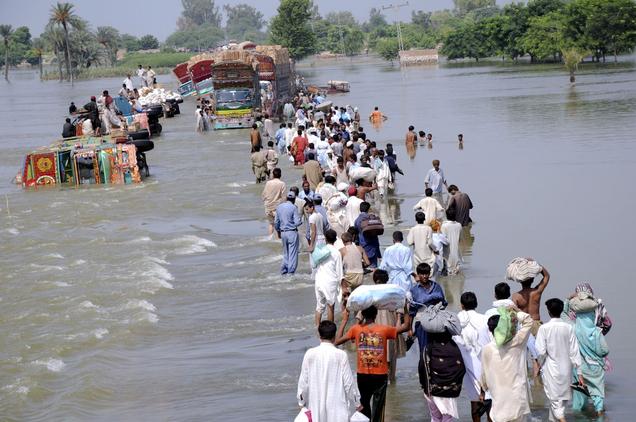

Case Study: River Flooding
Create a set of case study notes explaining the natural and human causes and consequences of the Pakistan Floods, 2010.
You may find some resources below (do not forget to look for your own too)
Create a set of case study notes explaining the natural and human causes and consequences of the Pakistan Floods, 2010.
You may find some resources below (do not forget to look for your own too)
Possible sources
|
| ||||
|
|
|
|
|
|
|
|
Management issues and strategies
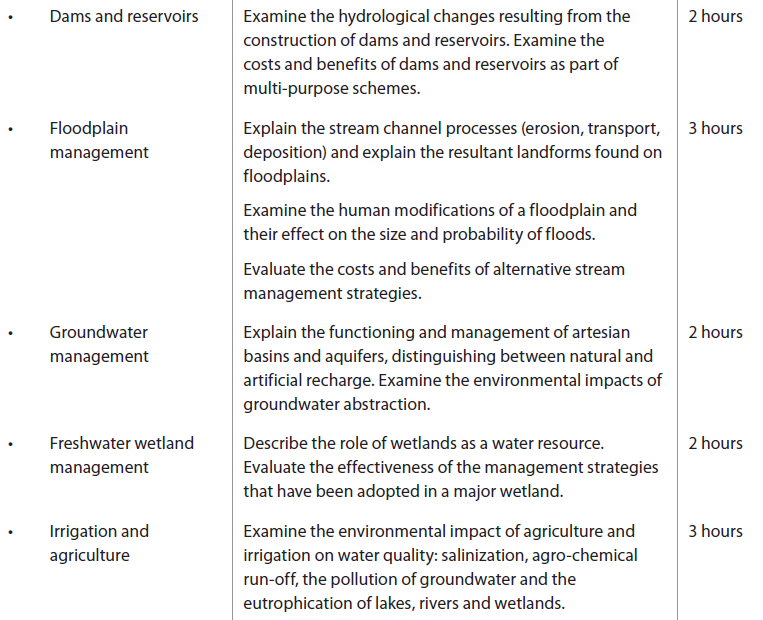
Dams and Reservoirs
|
Key terms
|
Hoover dam and reservoir
|

Using all the resources below complete the following worksheet. You may also use page 118-119 in the Course Companion book. |
| ||
|
| |||||
|
|
Click for link to more information on why dams need to be run well.
|

Case Study:
Create a set of notes of the Three Gorges Dam in China. |
| ||
Floodplain Management

You are going to split into pairs. Each pair will have to create a revision factsheet on one of the following (all diagrams should be done by hand):
Use the two PowerPoints below to help you.
- River erosion, Transportation and deposition (name, explain and draw diagrams to illustrate where and why they occur)
- Erosional Features (V-Shaped Valleys & Waterfalls)
- Depositional Features (Floodplains, levées, deltas)
- Joint feature (meanders, oxbow lakes & point bars)
Use the two PowerPoints below to help you.
|
| ||||
OR
An alternative task could be to make a video (screen capture or iXplain) where you record the drawing of the diagram and then overlay the auditory explanation.
An alternative task could be to make a video (screen capture or iXplain) where you record the drawing of the diagram and then overlay the auditory explanation.

Human Modifications (Urban Hydrology): Humans can change the hydrology of rivers in many ways. Below is a summary of some of the most common. Your task is to find an example of each of these and briefly outline the key points.
- Urbanisation: Urbanisation tends to cause deforestation reducing interception and transpiration. Sewers also reduce surface stores and therefore evaporation. Urban areas usually create large impermeable surfaces which can lead to greater surface run-off.
- Sewer Systems: Generally sewer systems create create artificial channels, which often reduces a rivers' lag time and can lead to increased flooding downstream.
- Pollution: Transport, industry and housing all create pollution which works its way into the water system. Areas that don't have proper sewers and water treatment tend to be effected more. Metals and chemicals are particularly polluting.
- Water table (groundwater depletion): Unsustainable use of groundwater can cause subsidence. Mexico City has experienced subsidence because of aquifer depletion underneath the city. On the scale, London has actually seen its water table rise since deindustrialisation has meant the demand for water has fallen.
- Deforestation: Deforestation reduces interception and transpiration. Removal of trees can also increase the risk of mudslide by reducing slope stability and stops root uptake. Less interception speeds up the rate the ground become saturated and therefore increases the risk of flooding
- Micro-climate: Urban areas create heat islands which can increase convectional rainfall. Particulates released by industry and transport also make excellent condensation nuclei.
- Channelisation: Artificially smoothing channels may remove river discharge from one area, but areas down stream that haven't been smoothed are likely to experience an increase risk of flooding.

Sort activity: We have already previously looked at the Pakistan 2010 floods. If you were the government of Pakistan which river management strategy would you pick for the Swat valley and why? Create a proposal of your top 5 ranked strategies and your worst 5. After this, discuss the criteria of what is best to worst what factors should we consider and if they are not useful to the Swat valley in which situations might they be more useful?
| River Management Strategies |

Case Study:
River Danube - Evaluate river management strategies.
Deconstruct the Case Study document. The language used is intentionally challenging, I want you to try to pick out the relevant information (note taking skills are important_To do this you will need to consider certain areas:
River Danube - Evaluate river management strategies.
Deconstruct the Case Study document. The language used is intentionally challenging, I want you to try to pick out the relevant information (note taking skills are important_To do this you will need to consider certain areas:
- Locate the Danube.
- Overview of why it is important.
- Historical view at its uses.
- Identify the problems/issues.
- Examine the role of WWF and its partners (what is being done?)
| Danube River Management Case Study |
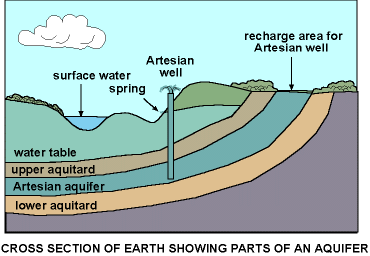
Ground Water Management
Key Terms
|
|

The Great Artesian Basin
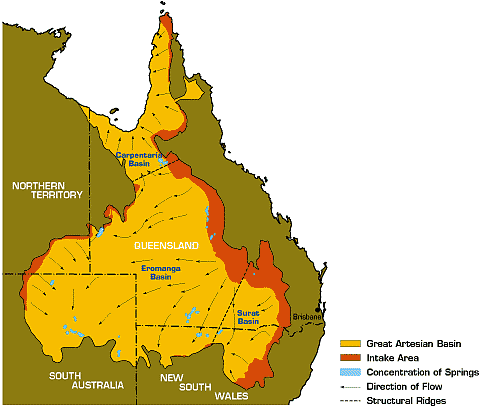
Great Artesian Basin - Australia
|
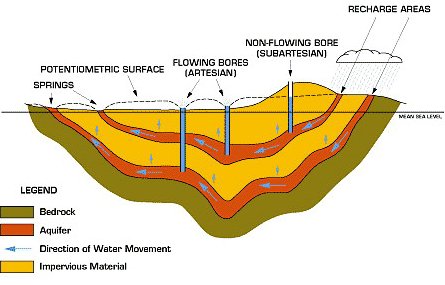
Great Artesian Basin - Cross section
|
|
Causes of Groundwater Usage
|
Causes or Groundwater Recharge
|

Identify and explain the environmental effects of ground water abstraction
Water extraction, water abstraction, or groundwater extraction is the process of taking water from any source, either temporarily or permanently. This water can be used for irrigation, industry, recreation, flood control or treatment to produce drinking water.
Impacts due to over-abstraction
Impacts due to over-abstraction
Fresh water wetland management
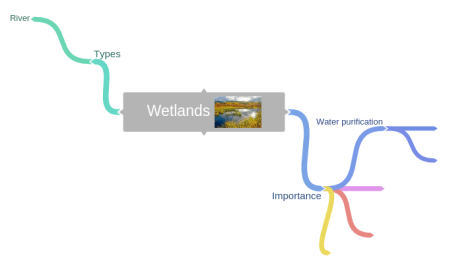
Wetland: is an area of land whose soil is saturated with moisture either permanently or seasonally. Such areas may also be covered partially or completely by shallow pools of water. Wetlands include swamps, marshes and bogs. The water found in wetlands can be saltwater, freshwater, or brackish (a mixture of fresh and salt water). The world's largest wetland is the Pantanal which straddles Brazil, Bolivia and Paraguay in South America.

Using the above YouTube and the following link create a Spider Diagram (you may use Coggle) outlining the types of wetlands and explaining the importance of wetlands.
The Value of Wetlands
The Value of Wetlands
|
|
|
Case Study
Kissimme River
Kissimme River
|
Location
|
Background
|
|
|
|
Other sources
Use the Course Companion pg. 129 and the US Gov. Website
Use the Course Companion pg. 129 and the US Gov. Website
|
|
| ||||||

|
IB Style Question:
How effective are the management strategies adopted in a named wetland you have studied? Plan and prepare the the above essay question for a timed essay in class. |
Competing demands for water
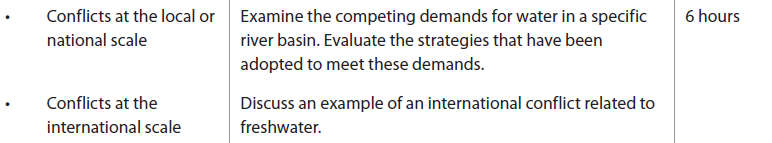
Conflict at the local scale:
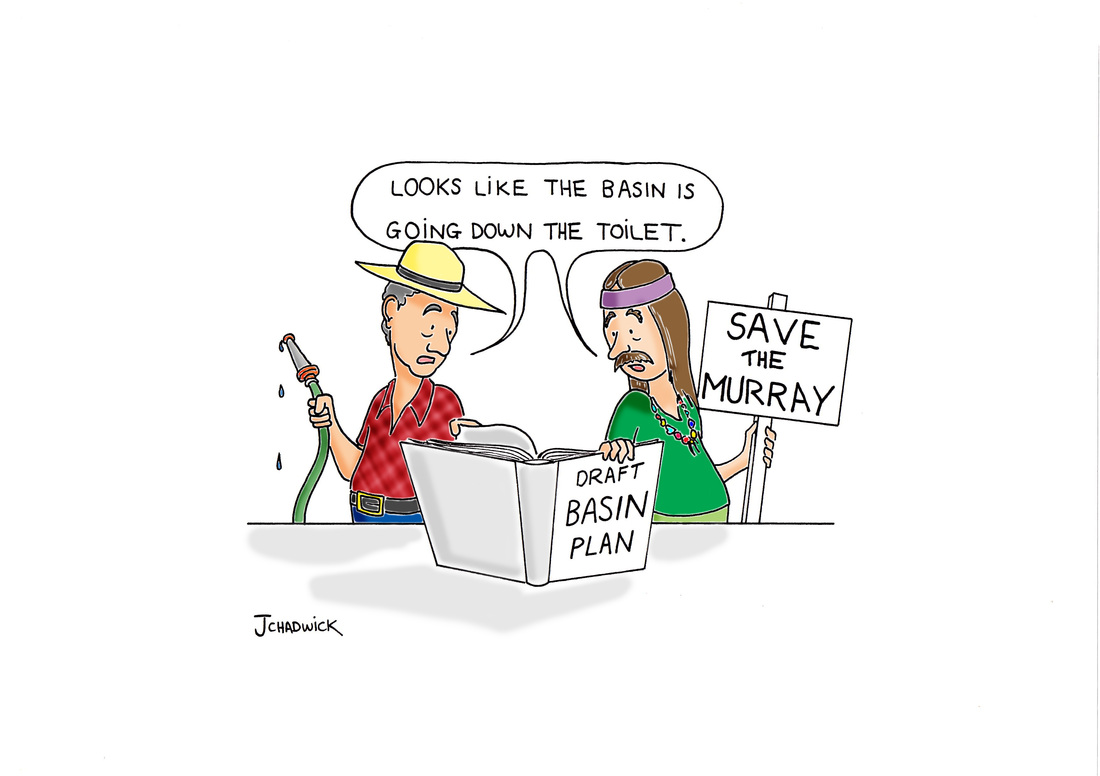
The Murray-Darling Basin
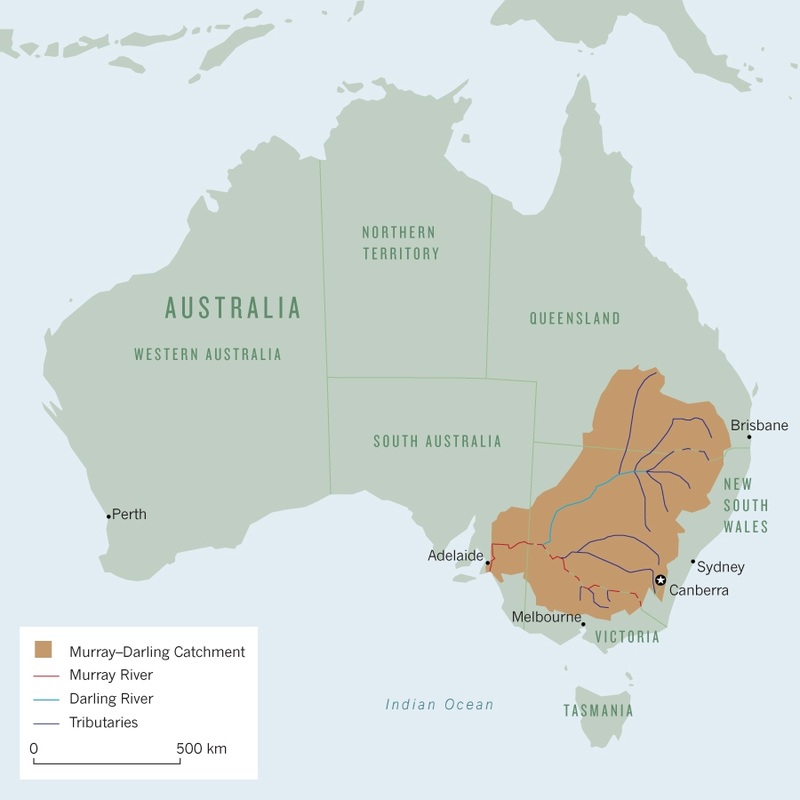
Murray-Darling Drainage Basin
|
|

Questions to answer in Murray-Darling Report:
|
|
Sources
|
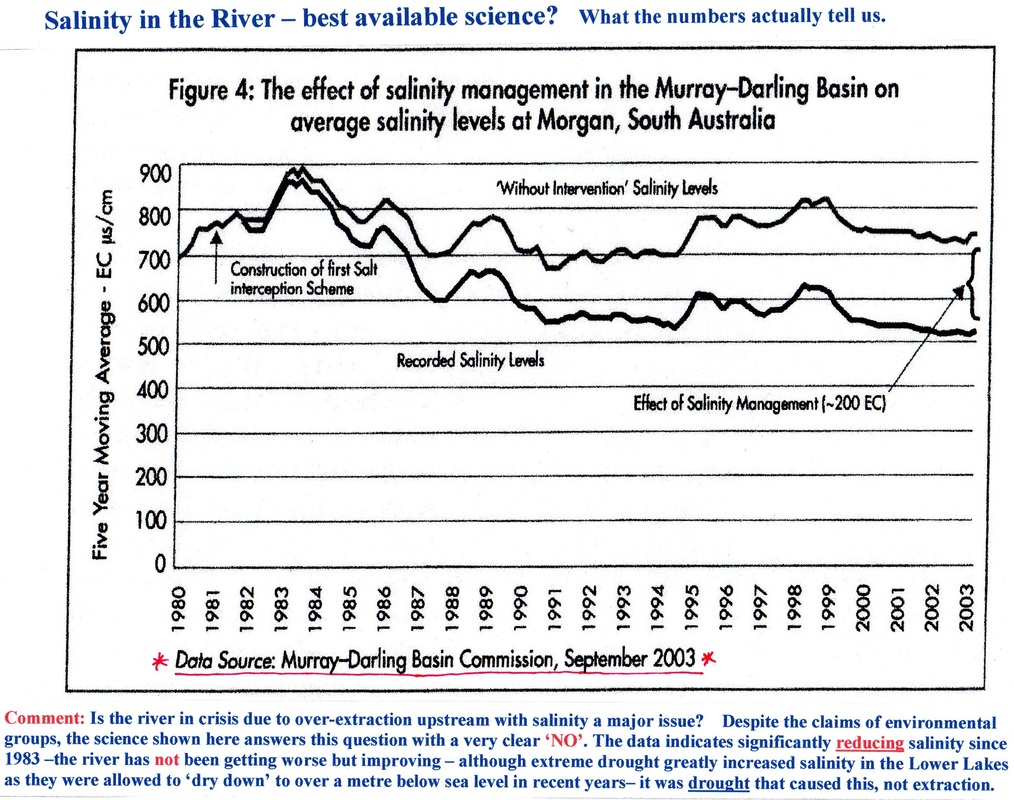
Salinity levels Murray-Darling Basin
| ||||
International freshwater conflict: River Nile

Case Study
Questions to answer on the River Nile:
- Describe the location of the Drainage Basin.
- What is the importance of Nile Drainage Basin to the region?
- Identify all the stakeholders competing for water from the drainage basin.
- How has the basin been impacted by this demand?
- What strategies have been implemented to manage this basin?
- How successful have these strategies been?

Water security
|
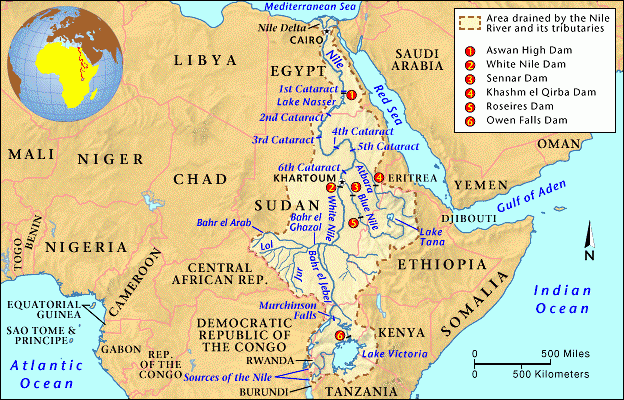
Nile Basin
|
Why is the River Nile Important?
Sources
- Tourism: The White Nile rapids in Uganda attracts thousands of tourists a year, as does Lake Victoria (fed by Nile) on the border of Kenya, Uganda and Tanzania and of course the River Nile in Egypt which is lined by ancient monuments.
- Agriculture and Irrigation: We have already seen how Egypt depends on the Aswan Dam to irrigate the desert (Dams and Reservoirs). All other countries along the Nile's course would also like to increase agricultural production and possible increase agricultural exports. Ethiopia is meant to have the best coffee in the world and Kenya has a growing flower industry.
- Transport: In countries that often lack good roads and railways, the lakes on the Nile and the Nile itself can make a vital transport link within and between countries. The waterways can help promote trade, particularly useful for landlocked countries like Burundi and Rwanda.
- Wildlife: The Nile is home to many species; including the Nile crocodile and hippopotamus. Many areas along the Nile have been protected as National Parks e.g. Murchison Falls NP in Uganda.
- Drinking Water: Most African countries are experiencing growing population as well as increasing economic development. With bigger populations, more water is needed. With economic development the demand for washing machines, dishwashers, showers, etc. also increase.
- HEP: Egypt currently generates much of its power from the Aswan High Dam. Other countries along the Nile's course would also like to be able to use the Nile's power and reduce their dependency on wood and other fossil fuel imports.
- Drought Control: East Africa regularly suffers from drought periods (northern Kenyan is suffering an ongoing drought). If the Nile's water can be stored in reservoirs, it might be able to reduce the effects of many of the regions droughts.
Sources
- East Africa seeks more Nile water from Egypt - BBC article
- How should the Nile's water be shared - BBC article
- Battle for the Nile as rivals lay claim to Africa's great river - Guardian article
- Ethiopia and Egypt dispute the Nile - BBC article
- East African countries to challenge colonial Nile treaty - Telegraphgh article
- Nile restrictions anger Ethiopia - BBC article
|
|
|
|
|
|
