Please help keep the Geographer Online a FREE resource
Hazards and Disasters - Risk assessment and Response
Index
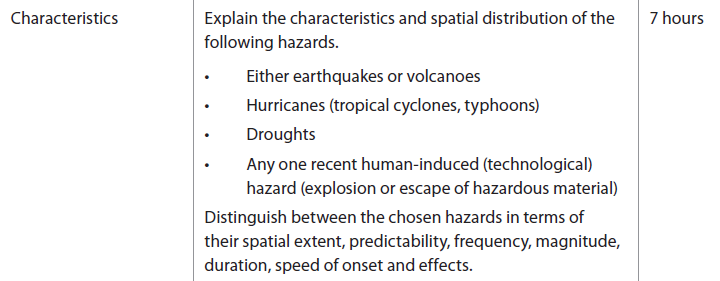
Characteristics of Hazards
Key Terms
|

Using the definitions and presentation above - define Hazard, Disaster and distinguish the difference between the two.
What determines the severity of a hazard?
Duration: The length of time that a hazard lasts for. As a general rule the longer the hazard the more severe it is likely to be. For example and earthquake that lasts 1 minute is likely to be more severe than one that last two seconds and a drought that lasts ten years is likely to be more severe than one that last three months.
Magnitude: This is the strength of a hazard. Most hazards are measured on a scale e.g. the Richter scale or the volcanic explosivity index (VEI). Generally speaking, the stronger the hazard the more severe the hazard is.
Predictability: Some hazards are easier to predict than others. For example, volcanoes normally give warning signs before they erupt and tropical storms can be tracked from development to landfall. However, others like earthquakes are much harder to predict. Generally speaking hazards that hit with no warning are going to be more serious.
Regularity: If hazards happen often and in quick succession e.g. a earthquake followed by multiple aftershocks then then the severity is likely to be greater. During hurricane seasons, countries can be hit by repeated storms each causing greater damage because it has not been possible to recover from previous damage.
Frequency: The return interval of hazards of certain sizes. For example earthquakes with a magnitude of over 8.0 happen on average once a year, but earthquakes of only 3 or 4 happen many times a day. If the hazard is a less frequent strong event, then it is going to have a bigger impact.
Speed of onset: If the peak of the hazard arrives first or arrives quickly e.g. an earthquake, then the affects are likely to be worse than one that arrives slowly e.g. a drought.
Spatial concentration: Where hazards are located or centred. For example earthquakes tended to be focused along plate boundaries, whereas tropical storms tend to be located in coastal areas in the tropics. Hazards that are located in known areas can be better prepared for and managed better.
Areal extent: If a hazard covers a large area e.g. a drought covering the whole of East Africa, then the severity of the hazard is likely to be more severe, than a flood hitting just one village.
Number of hazards: If a location is hit by multiple hazards that the affects can be more severe. For example hazard hotspots like Indonesia can be hit by earthquakes, volcanoes, landslides and flooding all simultaneously.
As a general rule as the magnitude of a hazard increases, the frequency of the hazard happening actually decreases.
(list from: Greenfieldgeography)
Earthquakes
|
Visit the the website to explain why earthquakes are formed:

Create a 4 slide Presentation explaining:
You can find the answers to these questions on the website above and in the course guide pg 198-199. | ||
What are earthquakes?
|
|
Earthquakes
|

Complete the following worksheet. |
| ||||
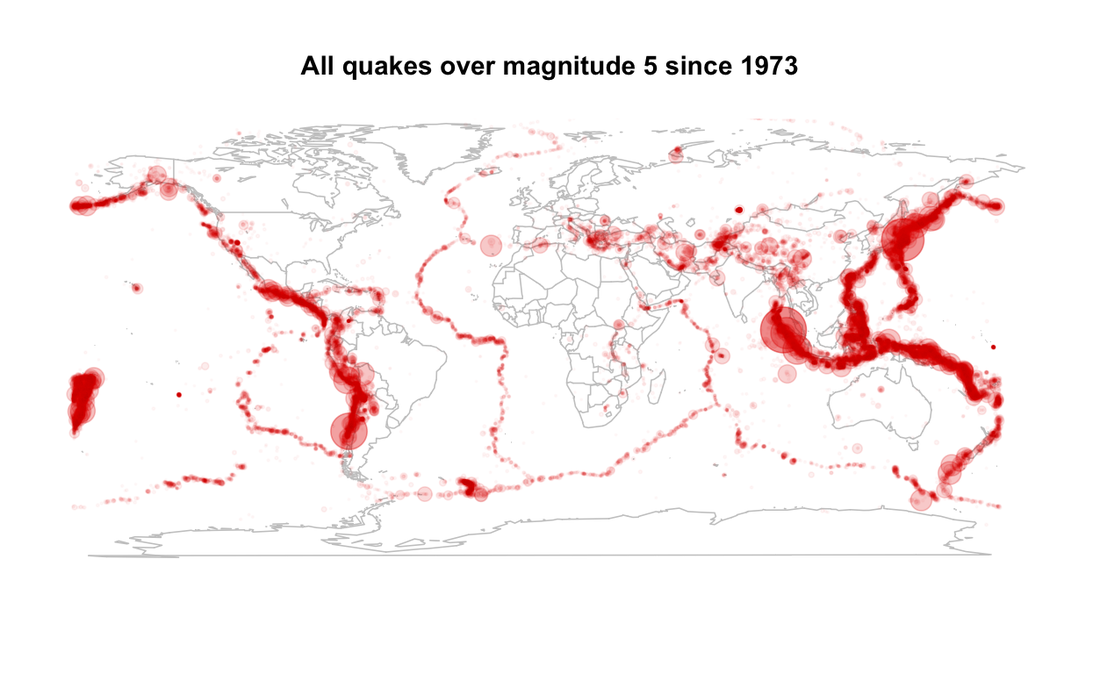
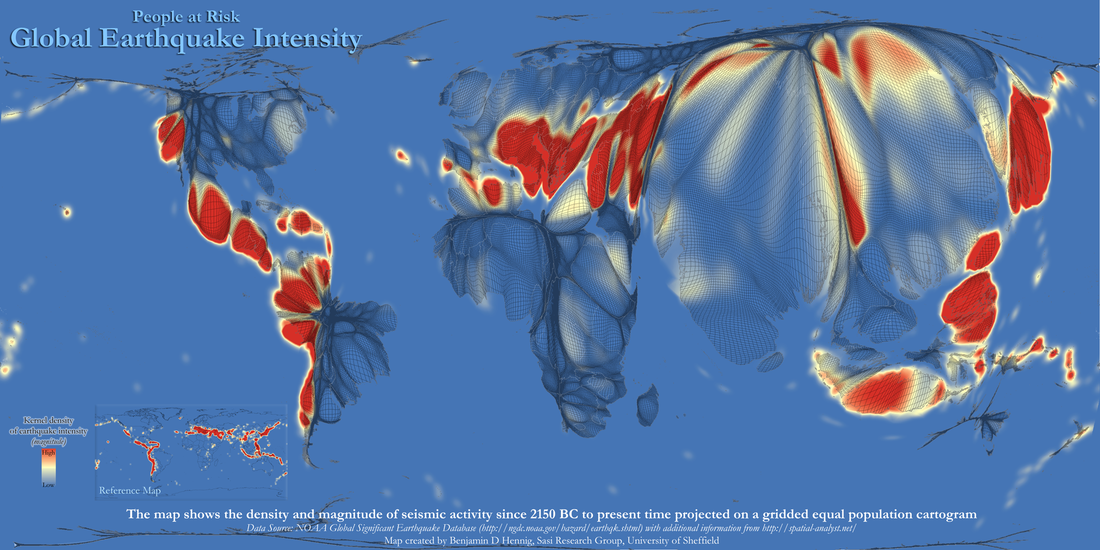
Spatial Extent
View the images below and describe the distribution of earthquakes throughout the world. Comment on their relationship with tectonic boundaries and on their proximity to large population concentrations.
View the images below and describe the distribution of earthquakes throughout the world. Comment on their relationship with tectonic boundaries and on their proximity to large population concentrations.


Predicting Earthquakes
|
|
Earthquakes are extremely hard to predict. Scientists can normally predict where earthquakes are likely to happen, but they can not predict when they will happen and how strong they will be. Scientists can attempt to predict by looking at:
|
Earthquake frequency
Earthquake frequency - High Magnitudes
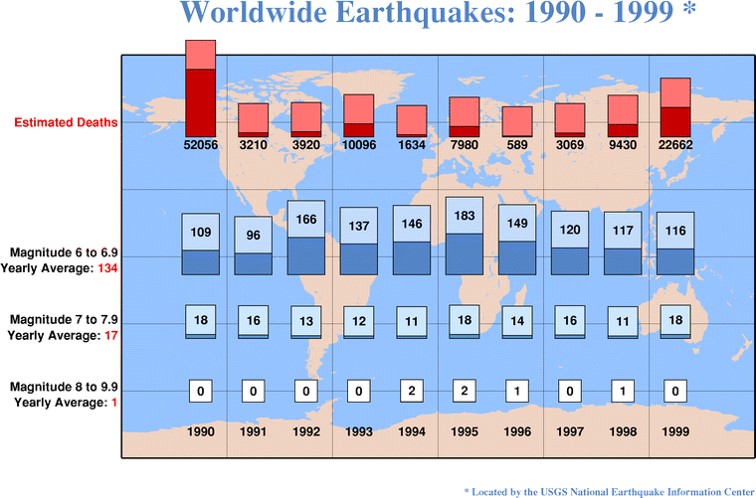
Earthquakes 1990-1999
|
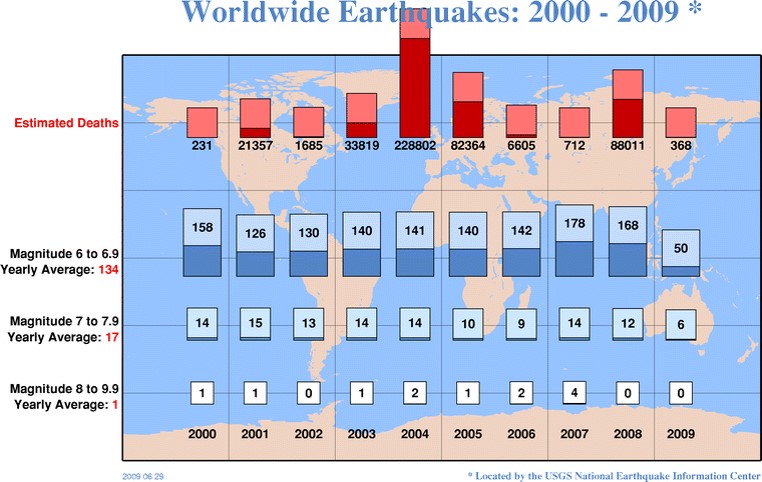
Earthquakes 2000-2009
|
Annual earthquake deaths
It is extremely difficult to asses whether any hazard is increasing in frequency because of two reasons:
The general consensus is that earthquakes are not increasing in frequency.
- We are better at detecting and reporting them due to improvements in technology
- We do not have an extensive record to draw from. Geological patterns can span hundreds of thousands of years but we only have accurate historical records spanning at most 100 years.
The general consensus is that earthquakes are not increasing in frequency.
Magnitude
The most common measures of earthquakes are:
Richter Scale (most common)
Richter Scale (most common)
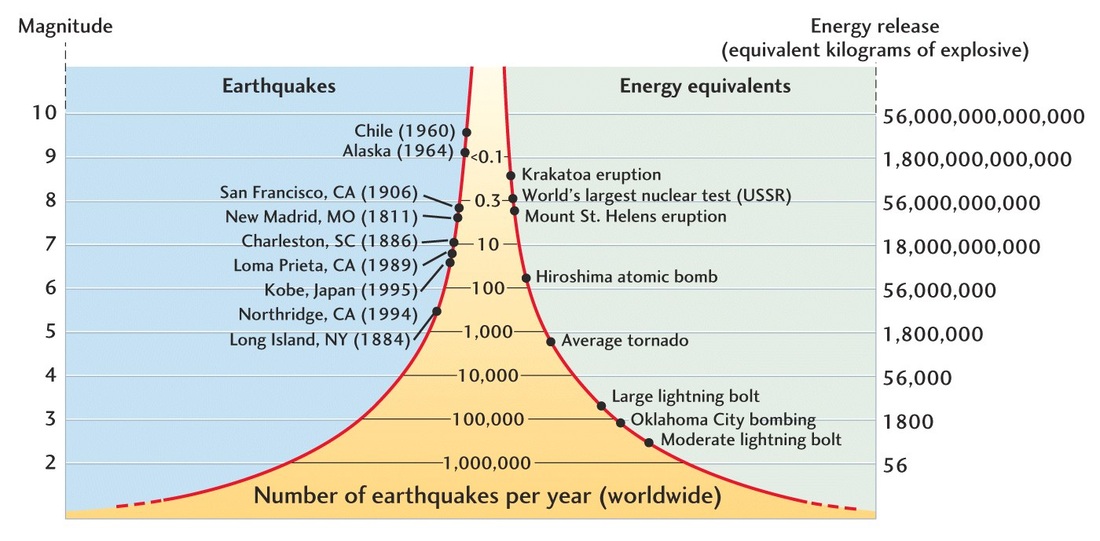 Richter Scale
Uses a Seismograph and the magnitude of an earth is classified through the zig-zag trace that shows the varying amplitude of ground oscillations (as a result of seismic waves) beneath the instrument. Sensitive seismographs, which greatly magnify these ground motions, can detect strong earthquakes from sources anywhere in the world. The time, locations, and magnitude of an earthquake can be determined from the data recorded by seismograph stations.
The magnitude of an earthquake is determined from the logarithm of the amplitude of waves recorded by seismographs. On the Richter Scale, magnitude is expressed in whole numbers and decimal fractions. For example, a magnitude 5.3 describes a moderate earthquake, whilst 7.3 denotes a major earthquake Because of the logarithmic basis of the scale, each whole number increase in magnitude represents a tenfold increase in measured amplitude. As an estimate of energy, each whole number step in the magnitude scale corresponds to the release of about 31 times more energy.
The magnitude of an earthquake is determined from the logarithm of the amplitude of waves recorded by seismographs. On the Richter Scale, magnitude is expressed in whole numbers and decimal fractions. For example, a magnitude 5.3 describes a moderate earthquake, whilst 7.3 denotes a major earthquake Because of the logarithmic basis of the scale, each whole number increase in magnitude represents a tenfold increase in measured amplitude. As an estimate of energy, each whole number step in the magnitude scale corresponds to the release of about 31 times more energy.
|
|
|
Moment magnitude scale
Developed in the 1970s. An earthquake produces many types of waves, which radiate from its epicenter and move with a wide variety of frequencies. Compared to the Richter scale, the moment magnitude scale can account for more types of these waves, and at more frequencies. It is thus better able to estimate the total energy of earthquakes, and can also relate these observations to the physical features of a fault.
Developed in the 1970s. An earthquake produces many types of waves, which radiate from its epicenter and move with a wide variety of frequencies. Compared to the Richter scale, the moment magnitude scale can account for more types of these waves, and at more frequencies. It is thus better able to estimate the total energy of earthquakes, and can also relate these observations to the physical features of a fault.
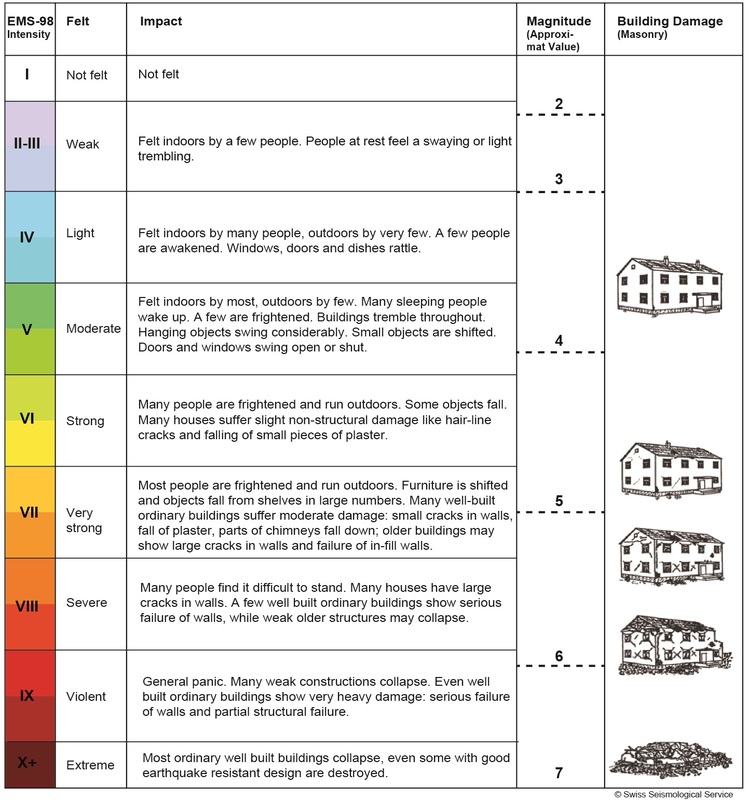
Mercalli Scale
A behavioral type classification of the resulting damage caused by earthquakes. It helps draw picture of the impacts along a transect from the epicenter. Rather than follow abstract logarithmic scale it describes the physical and human impacts of the earthquake as experienced on the ground.
A behavioral type classification of the resulting damage caused by earthquakes. It helps draw picture of the impacts along a transect from the epicenter. Rather than follow abstract logarithmic scale it describes the physical and human impacts of the earthquake as experienced on the ground.
Mercalli Scale
|
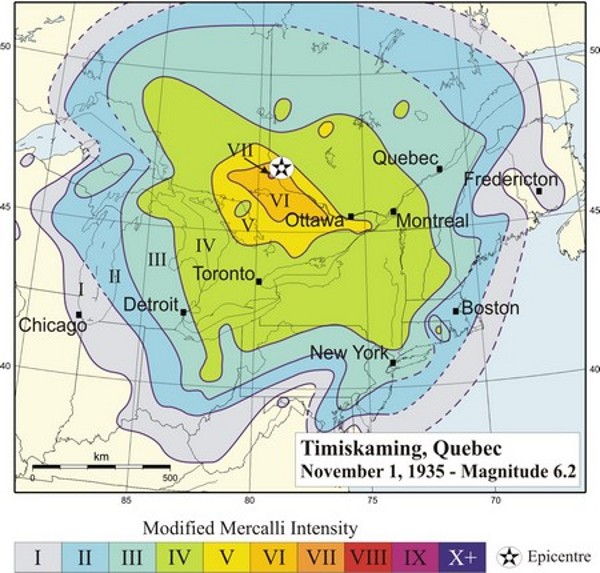
Mercalli mapping
|
Duration and Speed of onset
The actual duration of an earthquake depends mainly on the physical conditions around the quake and your location.
In general, the greater the length of the fault, the bigger the earthquake, and the longer the duration of the quake. For example, the magnitude 7.8 quake that occurred January 9, 1857, at Fort Tejon, California, was generated by a 224 mile (360 kilometer) fault and lasted a record time in the United States—about 130 seconds. The famous April 18, 1906, San Francisco earthquake lasted for 110 seconds; the fault line there is about 250 miles (400 kilometers) long. But this rule is not ironclad: The Loma Prieta, California, quake on October 17, 1989, lasted 7 seconds from a fault 25 miles (40 kilometers) long; the January 17, 1994, Northridge, California, quake also lasted 7 seconds and was caused by a 9-mile (14-kilometer) fault.
Other factors are important to a quake’s duration: The amount of time you shake depends on how far you are from the epicenter, the magnitude of the earthquake, and the type of rock under your feet. For example, if you are close to the epicenter you will experience a longer shaking; and the ground will usually shake longer for higher magnitude quakes (seconds for small quakes, close to a minute for major quakes). The type of rock is important, too. If you are on sand, the shaking will last almost three times as long as if you stood on a stable bedrock such as granite.
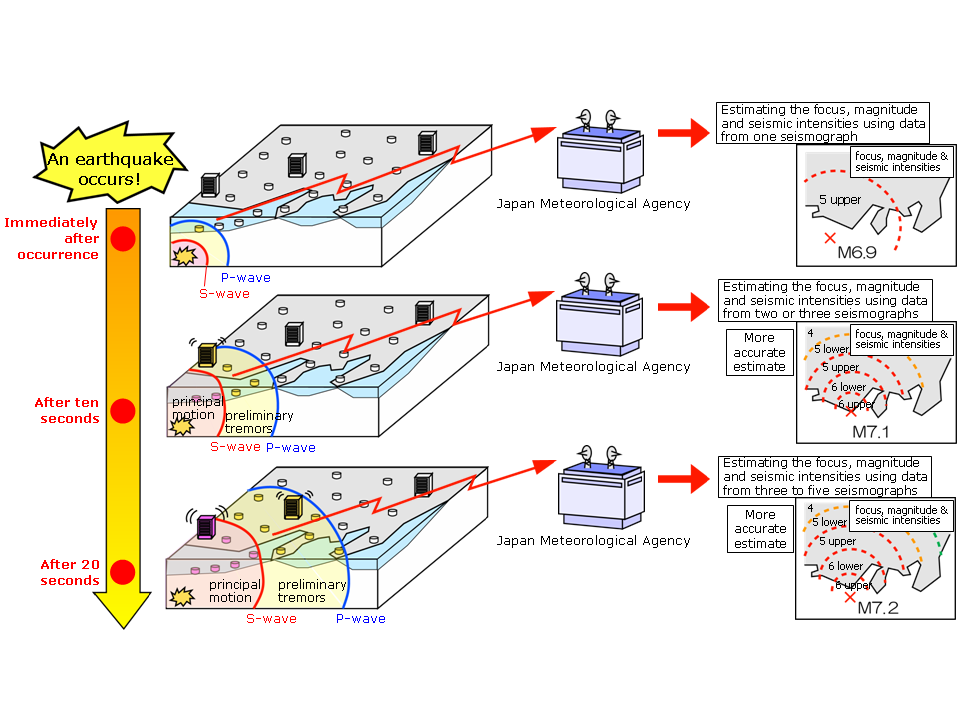
Earthquake early warning systems do not predict earthquakes but provide some limited warning of their effects. The maximum warning time is very short - maximum a few minutes.
How Do Earthquake Early Warning Systems Work?
The actual duration of an earthquake depends mainly on the physical conditions around the quake and your location.
In general, the greater the length of the fault, the bigger the earthquake, and the longer the duration of the quake. For example, the magnitude 7.8 quake that occurred January 9, 1857, at Fort Tejon, California, was generated by a 224 mile (360 kilometer) fault and lasted a record time in the United States—about 130 seconds. The famous April 18, 1906, San Francisco earthquake lasted for 110 seconds; the fault line there is about 250 miles (400 kilometers) long. But this rule is not ironclad: The Loma Prieta, California, quake on October 17, 1989, lasted 7 seconds from a fault 25 miles (40 kilometers) long; the January 17, 1994, Northridge, California, quake also lasted 7 seconds and was caused by a 9-mile (14-kilometer) fault.
Other factors are important to a quake’s duration: The amount of time you shake depends on how far you are from the epicenter, the magnitude of the earthquake, and the type of rock under your feet. For example, if you are close to the epicenter you will experience a longer shaking; and the ground will usually shake longer for higher magnitude quakes (seconds for small quakes, close to a minute for major quakes). The type of rock is important, too. If you are on sand, the shaking will last almost three times as long as if you stood on a stable bedrock such as granite.
Earthquake early warning systems do not predict earthquakes but provide some limited warning of their effects. The maximum warning time is very short - maximum a few minutes.
How Do Earthquake Early Warning Systems Work?
Earthquake warning system
|
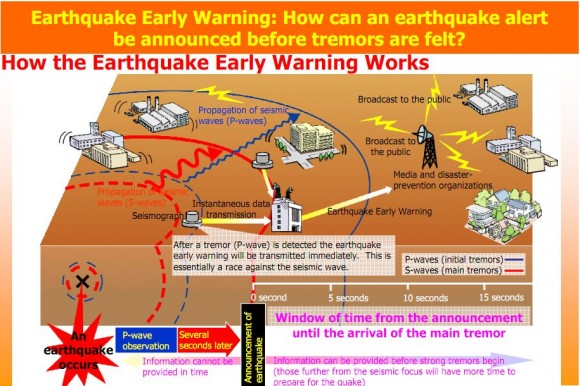
Earthquake warning systems - how it works
|
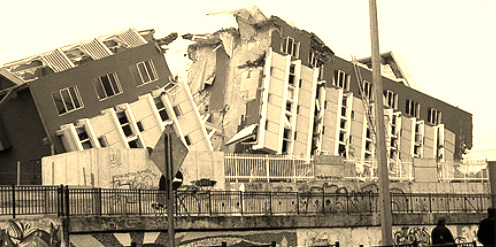
Effects
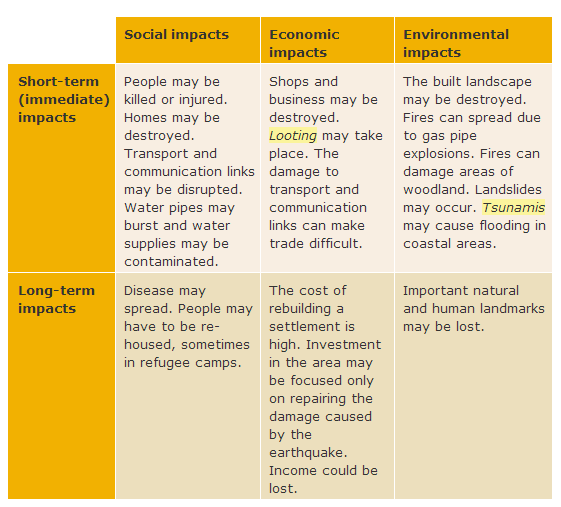
Short and long term impacts of an earthquake
|
|
Factors Affecting the Impact of Earthquakes:
Depth: If the hypocentre of an earthquake is close to the surface then it is more likely to cause greater damage than a deep earthquake.
Duration: A longer earthquake is likely to cause greater damage than an earthquake that lasts only a few seconds.
Magnitude: Obviously a stronger earthquake is going to have a greater impact than a weaker one.
Time of Day: Time of day can be important. If people are sleeping and get trapped in their beds more people can be killed. In Japan an earthquake that struck while people were cooking their evening dinner caused widespread secondary hazards (fire) that caused more deaths.
Epicentre Location: If the epicentre of an earthquake is an uninhabited region it is going to have a lesser effect than one under a densely populated city.
Geology: If an earthquake occurs in solid bedrock it is likely to cause less damage than one centred below an alluvial floodplain which may lead to liquefaction.
Economic Development (buildings, planning, preparedness): Generally speak more developed countries have better zonal planning, building codes and preparedness mean the effects of the earthquake are less.
Hurricanes
|

Using an A3 page create a labelled diagram explaining the formation of Hurricanes and the key weather characteristics necessary for their formation. |
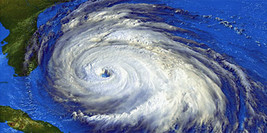
Hurricanes: A hurricane is a large low pressure system characterised by high winds and heavy rain. Hurricanes are also known as typhoons in East and South-east Asia and cyclones around the Indian Ocean. To be classified as a hurricane, winds must exceed 119km/hr (74 mph). Small low pressure systems are called tropical storms (63-118km/hr) and tropical depressions (0-62km/hr).
|
|
|
Click on the above image for the interactive presentation

Complete the following worksheet |
| ||||
Spatial extent
 Tropical Storm distribution
Hurricanes are mainly found between the tropics. Because hurricanes obtain their energy from the sea, they are found in coastal areas. The main hurricane hotspots are:
- The Caribbean, Central America and Southern US
- SE and E Asia e.g. Japan, China, Indonesia and the Philippines
- Northern Australia
- Bay of Bengal e.g. India and Sri Lanka
- East Africa and the Southern Arabian Peninsula e.g. Oman and Kenya.
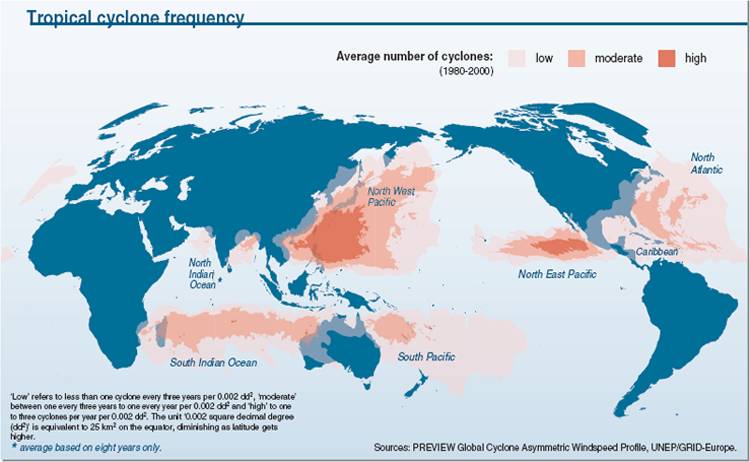
Tropical Cyclone Frequency
Predictability
Frequency and Magnitude
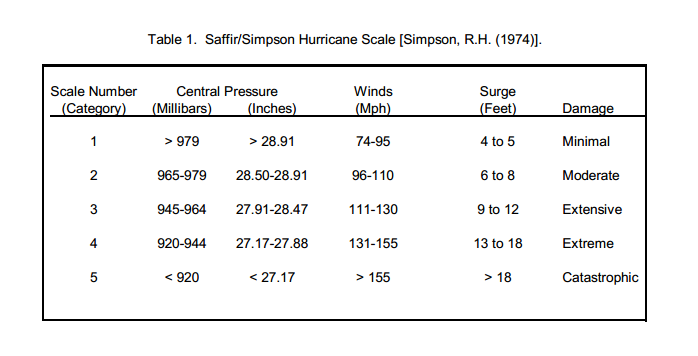 Saffir-Simpson Hurricane Scale
Hurricanes are normally measured by using the Saffir-Simpson Hurricane Scale developed by the National Oceanic and Atmospheric Administration. Hurricanes are measured on a scale of 1-5 depending on their wind speed and storm surge.
However, it must be noted that category five storms don't always cause the most damage. The amount of damage caused by hurricanes can depend on a number of factors including:
However, it must be noted that category five storms don't always cause the most damage. The amount of damage caused by hurricanes can depend on a number of factors including:
- Where landfall is (populated or non-populated area)
- The development of the country
- The warning given to residents and the preparedness of residents.
- The existing conditions (saturated ground or not)
- The timing of landfall (high tide or low tide)
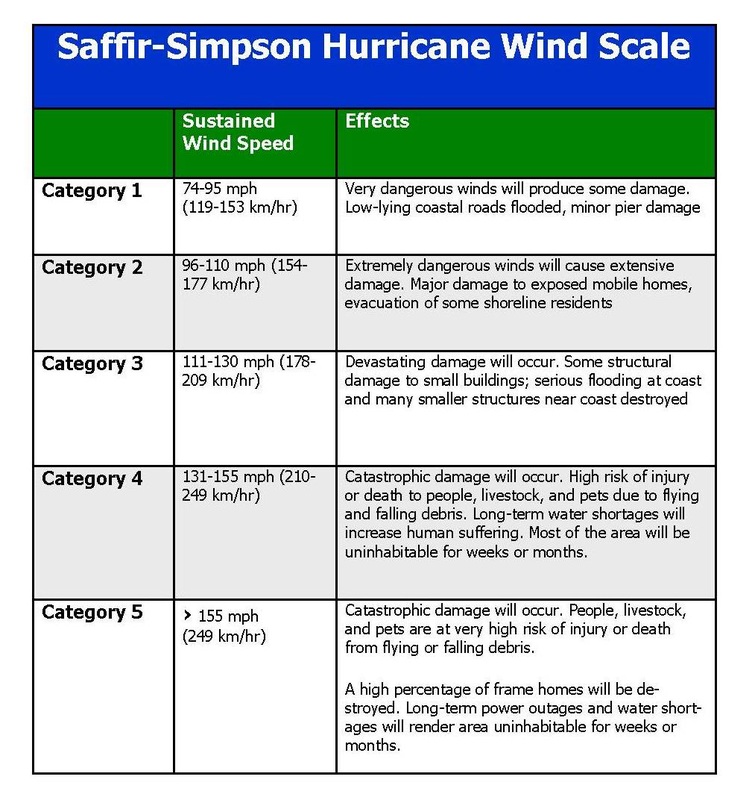
Hurricane Wind Scale
Scientists disagree on whether or not tropical storm activity has increased over recent years. Many scientist believe that global warming has caused larger and more frequent storm.
 Seasonal Tropical Storms
Is there a seasonal pattern in the number of Tropical Storms?
What do you think?
Create a graph on excel and plot the line of best fit using the data table below.
Create a graph on excel and plot the line of best fit using the data table below.
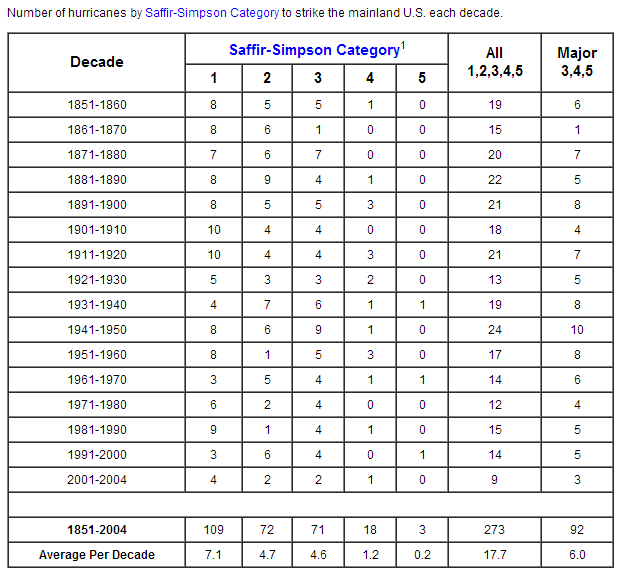
Hurricane Frequency per decade
|
Number of Hurricanes since 1855
Red (Category 3+)
Green (Hurricane strength)
Yellow (Tropical storms)
|
Speed of onset and Effects
Timings and path of a Hurricane
| cep_katrina.ppt |
|
|
|
Drought
A drought is a prolonged period where the demand for water exceeds supply (water stress), droughts can technically happen anywhere in the world. However, the most severe droughts tend to be located in certain areas of the world.

Complete the following worksheet. |
| ||||
Spatial Extent
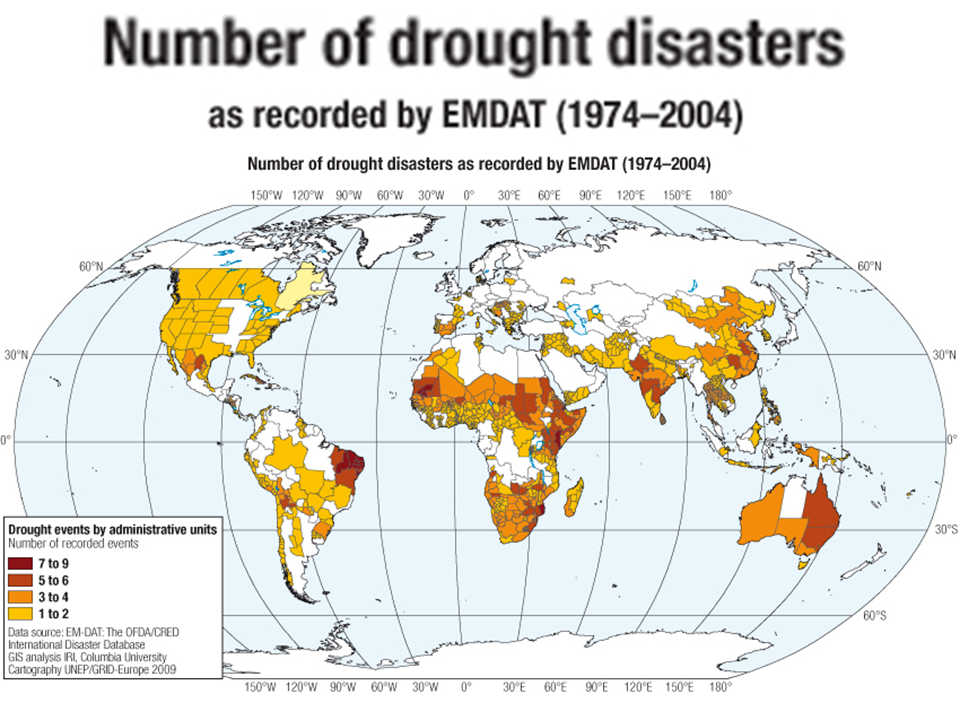
Number of drought Disasters
|
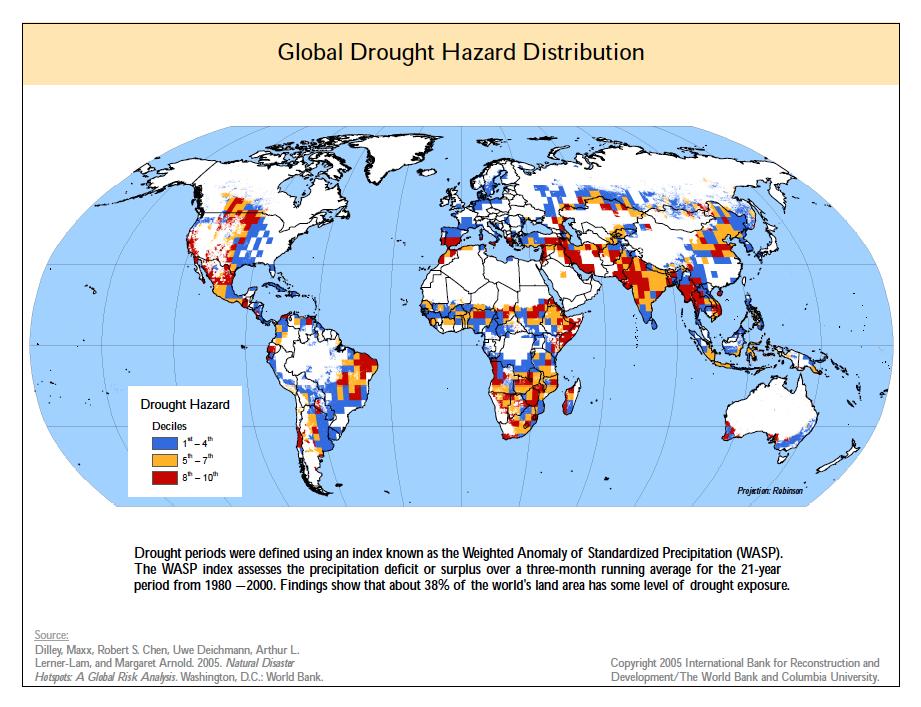
Global Drought Hazard Distribution
|
Predictability, Frequency and duration
Studies conducted over the past century have shown that meteorological drought is never the result of a single cause. It is the result of many causes.
Scientists don’t know how to predict drought a month or more in advance for most locations. Predicting drought depends on the ability to forecast two fundamental meteorological surface parameters, precipitation and temperature. From the historical record we know that climate is inherently variable. We also know that anomalies of precipitation and temperature may last from several months to several decades. How long they last depends on air–sea interactions, soil moisture and land surface processes, topography, internal dynamics, and the accumulated influence of dynamically unstable synoptic weather systems at the global scale.
Meteorologists have made significant advances in understanding the climate system. It may now be possible to predict certain climatic conditions associated with ENSO (El Nino) events more than a year in advance. For those regions whose climate is greatly influenced by ENSO events meteorological forecasts can reduce risks in those economic sectors (mainly agriculture) most sensitive to climate variability and, particularly, extreme events such as drought.
|
|
|
|
Magnitude
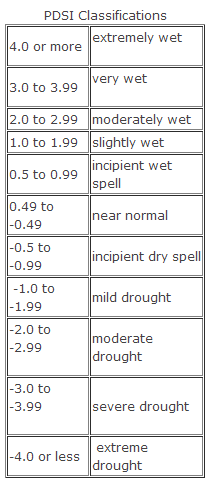
Palmer Drought Index
|
Palmer Drought Index - USA
The Palmer Drought Index, sometimes called the Palmer Drought Severity Index and often abbreviated PDSI, is a measurement of dryness based on recent precipitation and temperature.
|
Effects
|
|
Human Induced Hazard
Chernobyl is located in the Ukraine, north west of the capital city Ukraine. The Ukraine is located in eastern Europe. However, at the time of the accident the Ukraine was part of the USSR (Union of Soviet Socialist Republics) and only became independent again in 1991 with the collapse of the USSR. The Ukraine has a population of about 46 million, although this figure is declining because of negative population growth (natural decrease).
The Chernobyl nuclear accident took place at 01:23 local time on the 26th April 1986. The accident actually happened when scientists at the plant were testing the plants safety procedures. The Chernobyl nuclear accident is considered to be the worst nuclear accident in history. It is one of only two nuclear accidents to be classified level 7 (most severe) on the International Nuclear Events Scale. The second accident is the much more recent one at the Fukushima Daiichi Nuclear plant in Japan caused by the 2011 earthquake and tsunami.
The Chernobyl nuclear accident took place at 01:23 local time on the 26th April 1986. The accident actually happened when scientists at the plant were testing the plants safety procedures. The Chernobyl nuclear accident is considered to be the worst nuclear accident in history. It is one of only two nuclear accidents to be classified level 7 (most severe) on the International Nuclear Events Scale. The second accident is the much more recent one at the Fukushima Daiichi Nuclear plant in Japan caused by the 2011 earthquake and tsunami.

Case Study: Chernobyl
| disaster_in_chernobyl.ppt |
Vulnerability
Why do people live in hazardous areas?


| vulnerability_1.pptx |

Follow the instructions at the end of the above presentation
(The articles needed are found below)
(The articles needed are found below)
|
|
| ||||||
Risk and Risk Assessment
The Progression of Vulnerability
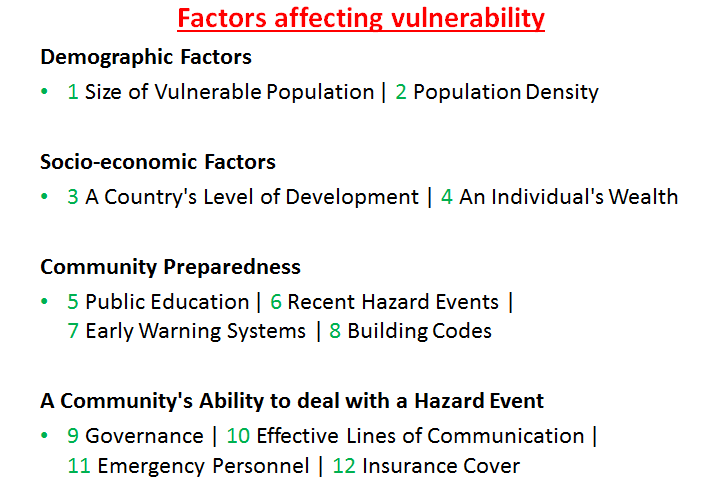
Vulnerability: The susceptibility of a community to a hazard or to the impacts of a hazard event.
Risk: The probability of a hazard event event causing harmful consequences (death, injury, loss of property, damage to environment, etc.)
Vulnerability: The susceptibility of a community to a hazard or to the impacts of a hazard event.
Risk: The probability of a hazard event event causing harmful consequences (death, injury, loss of property, damage to environment, etc.)

IB Style Question: Using examples examine the factors that impact a region's exposure to the risk of a disaster.
Plan this question creating detailed notes - you will need to be able to revise from these notes!
Plan this question creating detailed notes - you will need to be able to revise from these notes!
| Haiti Earthquake 2010 - A case study of vulnerability |
|
| ||||
| USA and Ethiopia - Drought |
Risk Perception
Risk can be very personal and is influenced by:
- Experience: If you have dealt with the hazard before your perception of risk can either increase or decrease depending on your now more informed view.
- Material well being: Wealth provides you with more choices and potential more protection to certain hazards.
- Personality: Are you an adrenaline junkie or do you get scared of the dark?
|
What factors influence our risk perception?
|
- Is the risk voluntary? Professional soldiers for example will perceive the risk of being shot differently from a civilian.
- Time scale: people perceive immediate impacts of a hazard as more severe and 'real' than long term ones. In an earthquake for example the risk of a building falling on you is more feared than the long term risk to your health.
- Psychological perception: certain hazards create a very intense fear response in humans for example the fear of fire and any hazard that might cause this will be perceived as worse than say an avalanche.
- Understanding/Knowledge: We fear what we do not know much about or we fear it less due to a limited understanding of the true risk.
- Media: Certain hazards are widely publicized and covered in the international media. This can colour our perception of risk.
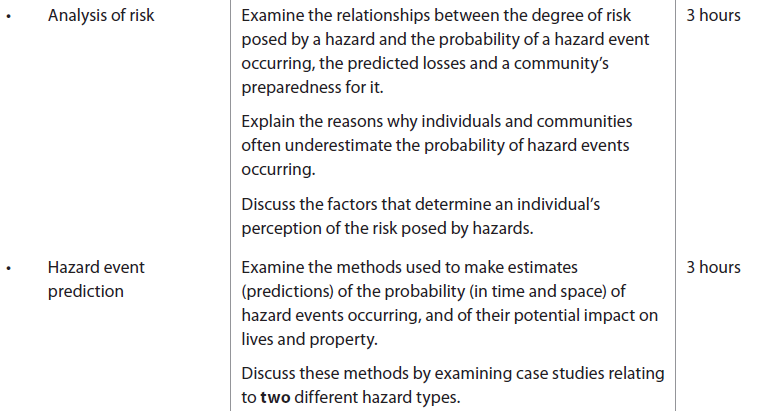
Hazard Event Prediction

Case Studies Group Task:
Choose one of the following possible Case Studies:
Volcano: Montserrat
Hurricane: Katrina
Your task is to create a 30 minute presentation to the rest of the class on Hazard prediction specifically related to your example. The presentation needs to have:
You will need to:
Discuss how easy it is to predict this hazard in terms of
You will also need to use specific examples to demonstrate the above information your each specific case study.
Choose one of the following possible Case Studies:
Volcano: Montserrat
Hurricane: Katrina
Your task is to create a 30 minute presentation to the rest of the class on Hazard prediction specifically related to your example. The presentation needs to have:
- A PowerPoint outlining the Case Study, providing photographs, details and facts.
- A detailed hand out of all notes needed for this topic (designed to accompany the PowerPoint)
- Video or interactive resource that you can use to enhance your presentation. YouTube is good for this - maximum Video length 15 minutes. - You will need to download the YouTube so as to play it in class (you may use YouTubeDownloader)
You will need to:
Discuss how easy it is to predict this hazard in terms of
- Timing
- Location
- Area impacted
- Risk to people and property
You will also need to use specific examples to demonstrate the above information your each specific case study.
| criteria_for_marking_in_class_presentation_task.docx |
Disasters
Definitions
IB
Disaster: A major hazard event that causes widespread disruption to a community or region that the affected community is unable to deal with adequately without outside help.
Hazard: A threat (whether natural or human) that has the potential to cause loss of life, injury, property damage, socio-economic disruption or environmental degradation.
Hazard event: The occurrence (realisation) of a hazard, the effects of which change demographic, economic and/or environmental conditions.
Remember a natural hazard is only a hazard if it is a threat to humans or there property, so if no humans are endangered and no property is damaged it is just a natural process or event e.g. an avalanche on an Antarctic mountain where no one lives.
UN Definition
"A disaster is a sudden, calamitous event that causes serious disruption of the functioning of a community or a society causing widespread human, material, economic and/or environmental issues which exceed the ability of the affected community or society to cope using its own level of resources".
For a disaster to be entered into the database of the UN's ISDR (International Strategy for Disaster Reduction), at least one of the following criteria must be met:
- A report of 10 or more people killed
- A report of 100 people affected
- A declaration of a state of emergency by the relevant government
- A request by the national government for international assistance

|
Measuring Disasters
We have already completed this part before. Main case study for a natural hazard: Hurricane Katrina Main case study for a human-induced hazard: Chernobyl |
Adjustments and responses to hazards and disasters
There are many methods available to dealing with hazards but they tend to fall into 3 categories:
NOTE: The difference between preparation and prevention is not clear cut - you should possibly view it as prevention being anything that actively prevents or mitigates a characteristic of a particular hazard causing loss of life or damage to property . For example, building and earthquake resistance structure reduces earthquake shock-wave damage and therefore is Prevention. However, government laws ensuring that all buildings needs to have anti-seismic technology is Preparation.
- Preparation - governments might consider how they can educate and prepare their populations for a disaster, so that they know what to do in a hazardous event. Also, governments can put into place laws and building codes to govern what can be built and to what standard, so that hazard impacts from hurricanes, earthquakes etc can be reduced.
- Prediction - this is basically the mechanism by which we try to forecast when and where a hazard will occur. There are a huge range of prediction methods now for a huge range of hazards, think about the Avalanche risk charts you may have seen whilst skiing. We can use satellites, river flow meters, sulphur dioxide meters, tilt meters etc to predict different hazards. We are better at predicting some hazards such as flooding, than we are others, such as earthquakes, because some of the warning signs are clearer and because of the amount of response time to each hazard.
- Prevention - these are the methods that we can put into place as human beings to either prevent the hazard entirely or prevent some of the negative impacts of a hazard. Some hazards such as forest fires can be prevented, by using fire breaks and prescribed (deliberate fires) major forest fires can be stopped. Other hazards cannot be prevented, such as Hurricanes. However, we can prevent some of the flooding during hurricanes by having correct drainage systems and coastal defences.
NOTE: The difference between preparation and prevention is not clear cut - you should possibly view it as prevention being anything that actively prevents or mitigates a characteristic of a particular hazard causing loss of life or damage to property . For example, building and earthquake resistance structure reduces earthquake shock-wave damage and therefore is Prevention. However, government laws ensuring that all buildings needs to have anti-seismic technology is Preparation.
Reducing Vulnerability - Preparation
(courtesy of:GreenfieldGeography)

Aid
Aid can be used as an adjustment before potential hazards strike or after hazards strike. Aid before hazards strike will take the form of development aid and may include:
Aid given after a hazard or during a hazard is more emergency aid. Emergency aid may include:
Aid may also be given at a later date to help rebuild after a disaster e.g. rebuilding homes, roads, schools, hospitals and electricity supply.
Aid can be used as an adjustment before potential hazards strike or after hazards strike. Aid before hazards strike will take the form of development aid and may include:
- The building of wells to reduce drought and disease
- The improvement of irrigation and the introduction of GM crops to reduce famine
- The building of dams to reduce the risk of flooding and droughts
- The building of roads and mobile networks to improve transport and communication throughout a country
- The building of schools to improve education about hazards
- The building of hospitals to reduce hazards like disease and treat people injured in hazards
Aid given after a hazard or during a hazard is more emergency aid. Emergency aid may include:
- The sending of rescue teams to search for victims
- The provision of medicine or doctors to help injured
- The provision of food and clean water
- The provision of tents and blankets, etc.
Aid may also be given at a later date to help rebuild after a disaster e.g. rebuilding homes, roads, schools, hospitals and electricity supply.

Insurance
Insurance is the act of insuring (protecting) property, people, businesses, etc. against the risk of something happening e.g. a person dieing or being injured, or property being flooded or burnt down. In order to insure something it is necessary to pay a premium appropriate to the likelihood of something happening e.g. a 80 year old person is likely to die fairly soon, so any premium will be high, but the likelihood of a 25 year old dieing in the near future is much less so the insurance premium will be much less. Normally insurance policies are taken out with private companies, but if the risk of insuring is too high, then private companies may refuse insurance. In these circumstances governments will sometimes offer insurance. For example the New Zealand government has a national insurance policy protecting all houses in New Zealand against earthquake damage. There are a number of advantages and disadvantages to insurance including:
Advantages
Disadvantages
Insurance is the act of insuring (protecting) property, people, businesses, etc. against the risk of something happening e.g. a person dieing or being injured, or property being flooded or burnt down. In order to insure something it is necessary to pay a premium appropriate to the likelihood of something happening e.g. a 80 year old person is likely to die fairly soon, so any premium will be high, but the likelihood of a 25 year old dieing in the near future is much less so the insurance premium will be much less. Normally insurance policies are taken out with private companies, but if the risk of insuring is too high, then private companies may refuse insurance. In these circumstances governments will sometimes offer insurance. For example the New Zealand government has a national insurance policy protecting all houses in New Zealand against earthquake damage. There are a number of advantages and disadvantages to insurance including:
Advantages
- People can rebuild if homes and/or property are damaged by hazards
- People can receive money for lost income if their job or business is impacted by a hazard
Disadvantages
- Not everyone can afford insurance
- Insurance is offered in all areas in all countries
- Insurance may be denied if the risk is too great
- People maybe less willing to spend money on protection, if they know insurance will pay for repairs.
Hazard Mapping (Land use planning or zoning)
Hazard maps are created by calculating the vulnerability of different areas to natural hazards. Hazard maps are often made to calculate populations vulnerability to hazards like earthquakes, hurricanes, volcanoes and floods. Once potential hazards are known then appropriate adjustments can be taken. Adjustments may include:
When creating a hazard map a number of variables will be considered. For example scientists creating an earthquake hazard map will look at the following:
Although hazard maps allow people and governments to prepare for hazards and enforcing zoning and planning regulations, it might also create difficulties for other people. For example in the UK the Environment Agency has just produced a flood risk map. This has helped communities prepare defences, but it has also meant that some people have seen the value of their property reduce and prevented them from getting insurance.
Hazard maps are created by calculating the vulnerability of different areas to natural hazards. Hazard maps are often made to calculate populations vulnerability to hazards like earthquakes, hurricanes, volcanoes and floods. Once potential hazards are known then appropriate adjustments can be taken. Adjustments may include:
- Creating zones where building is not permitted because it is too dangerous
- Creating zones where only low value uses are permitted e.g. farming
- Protecting areas that are vulnerable to hazards with the use of defences
- Evacuating vulnerable areas (and possibly allowing managed retreat in coastal areas)
- Rebuilding vulnerable areas to new building standards
When creating a hazard map a number of variables will be considered. For example scientists creating an earthquake hazard map will look at the following:
- Proximity to plate boundary or known fault
- Seismic history (frequency and magnitude)
- Geology (bedrock is much more stable than alluvial deposits which are vulnerable to liquefaction)
- Gradient (flatter ground is generally more stable than steep land)
- Possible secondary hazards (proximity to coast for things like tsunami, but also hills for landslides (forested/deforested))
Although hazard maps allow people and governments to prepare for hazards and enforcing zoning and planning regulations, it might also create difficulties for other people. For example in the UK the Environment Agency has just produced a flood risk map. This has helped communities prepare defences, but it has also meant that some people have seen the value of their property reduce and prevented them from getting insurance.
Prevention
How to prepare for a hazard - is it useful?
Case studies to consider:
Case studies to consider:
- Japan 2011 Earthquake
- Hurricane Katrina
- Haiti Earthquake
- Montserrat
- Chernobyl
- USA Drought - Dust Bowl
- Ethiopian Drough

IB Style Question:
Using named examples discuss the effectiveness of planning for a disaster [15].
| |||
Preparing for a Hurricane:
| preparing_for_hurricanes_and_coastal_flooding_a_handbook_for_local_officials.pdf |
Preparing for Earthquakes:
| How to reduce Earthquake Effects on Buildings? |
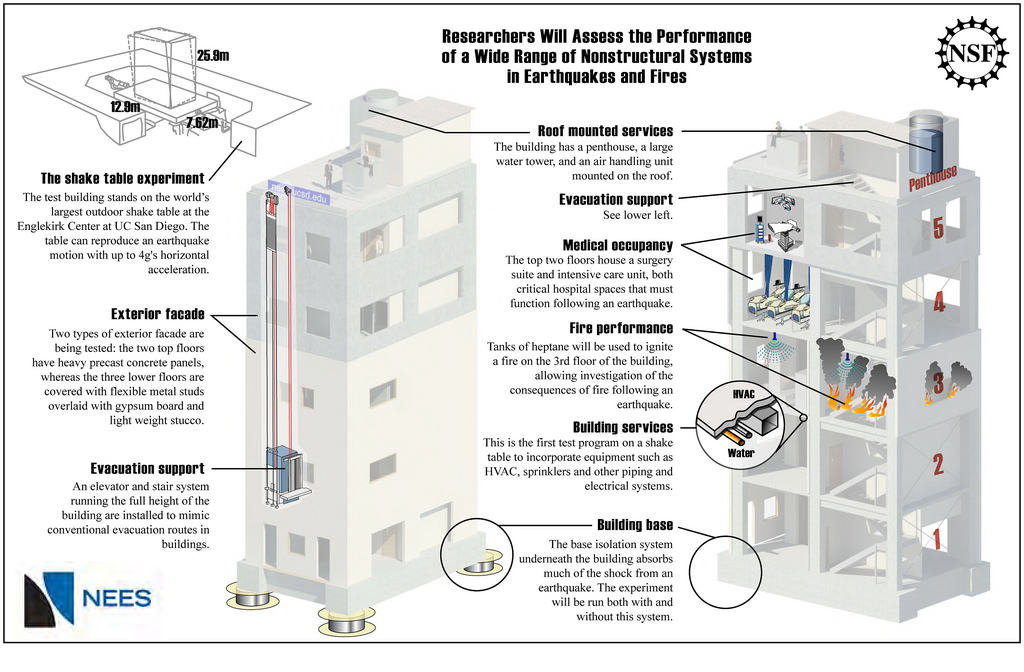
Seismic resistant buildings
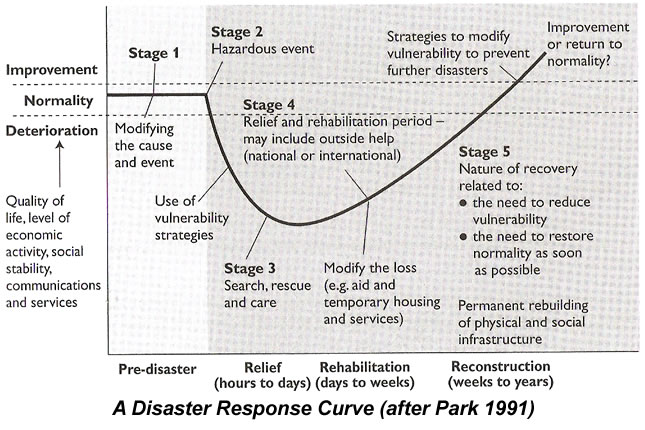
REsponses to a Hazard
Short-term response: A response in the days and weeks immediately after a disaster has happened. Short-term responses mainly involve search and rescue and helping the injured.
Mid-term response: Responses in the weeks and months following a disaster. Mid-term responses involve re-opening transport links and getting electricity and water supplies operational again. It might also involve establishing longer-term refugee camps where there has been large-scale destruction.
Long-term response: Responses that go on for months and years after a disaster. It involves rebuilding destroyed houses, schools, hospitals, etc. It also involves kick-starting the local economy.
Short-term
|
Mid-Term
|
Long-term
|
These can also be referred to as the 3R's:
- Rescue (Short-term)
- Rehabilitation (Mid-term)
- Reconstruction (Long-term)

|
Study the following graphs and discuss what they mean for disaster recovery. (Print and label) Read: The Psychology of Disaster |
|
|

|
Watch the following TED video and explain how the Recovers project can help with responding to a disaster. |
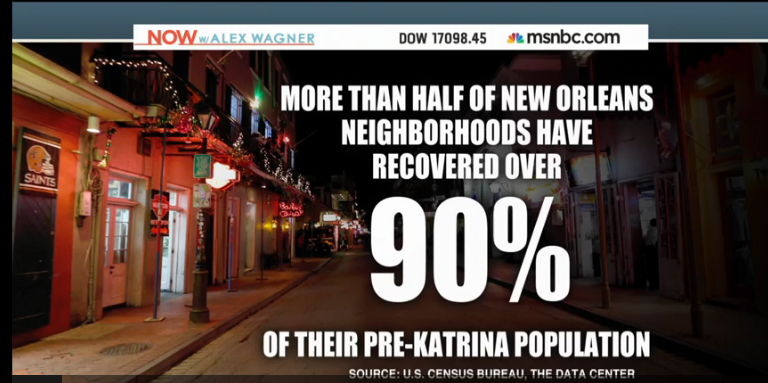
Recovering after HURRICANE Katrina
|
|
|