
Oceans and currents
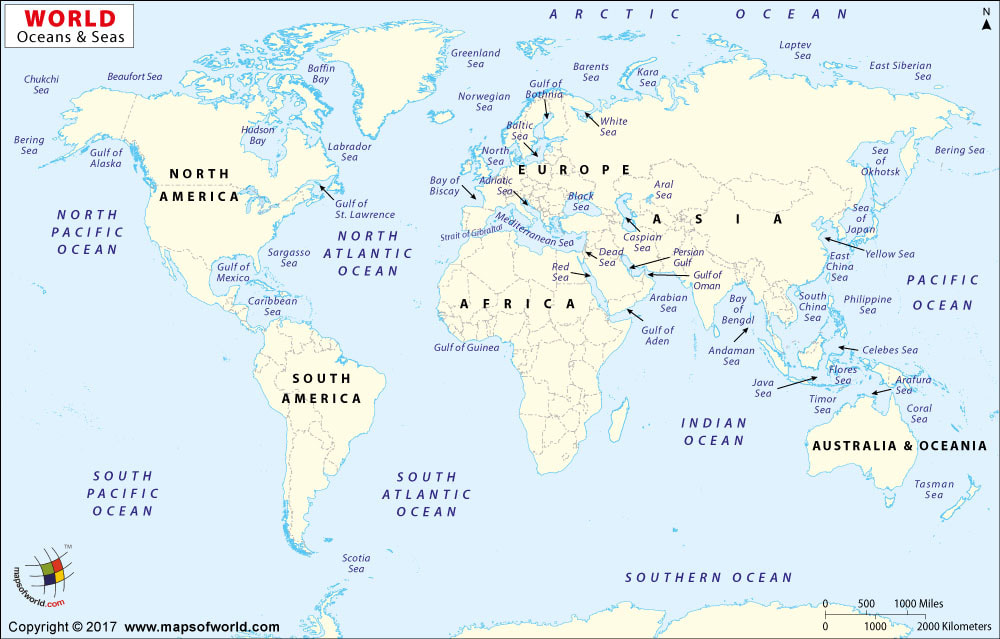
Oceans and Seas of our world
Water consumes 71% of Earth.
The size of the oceans varies markedly, and when ranked from the largest to the smallest, the list is:
1 The Pacific Ocean
The Pacific Ocean is the largest ocean covering more than 30% of the Earth. This is close to half of the water on Earth.
It touches the west coast border of the Americas along with east Asia and Australia.
The equator divides the Pacific Ocean into two separate parts – North Pacific Ocean and South Pacific Ocean.
Pacific means “peaceful” in Latin. It has the deepest trenches with an average depth of 3800m.
2 The Atlantic Ocean
The Atlantic Ocean is situated between the Americas and European/African continents. Atlantic Ocean is the second largest and saltiest ocean in the world.
It resembles an S-shape between the Americas, Europe and Africa. “Atlantic” originated from the Greek god “Atlas” who carried the sky for eternity.
The ocean bottom is composed of mid-Atlantic Ridge. This submarine mountain range extends all the way from Iceland to 58 degrees South latitude. It’s part of the longest mountain range in the world.
The Vikings, Portuguese and Christopher Columbus have extensively explored the Atlantic Ocean. Similarly to this day, it’s being used for trade routes such as the transatlantic trade route.
3 The Indian Ocean
Indian Ocean is the third largest ocean surrounding a densely populated region. It contains additional 20% of water on Earth’s surface.
It borders India at the North, East Africa, Australia and the Southern Ocean. Because if higher water temperature, it has limited marine life.
It is bounded by 4 tectonics plate boundaries and may include an additional plate boundary.
4 The Southern Ocean
In 2000, the Southern Ocean is the newest ocean recognized by the International Hydrographic Organization. It borders Antarctica in its entirety.
In terms of size, it’s the fourth largest at 20,327,000 square kilometers. It extends out to 60 degrees South latitude.
It’s an extreme environment and is the least understood of the 5 oceans. This is because it is unexplored, far from populated areas and has a severe climate.
Despite the Southern Ocean being unexplored, about 80% of all oceans in the world are unexplored. There’s still a lot of work to do for ocean exploration.
5 The Arctic Ocean
Arctic Ocean is the world’s smallest and shallowest ocean of all 5 oceans. Further to this, it is the coldest and least salty ocean.
In size, the Arctic Ocean is about the size of Russia. Because it’s located at the North Pole, the Arctic Ocean has polar ice. But over the years, glaciers have melted threatening sea levels to rise.
Despite the IHO recognizing it as the “Arctic Ocean”, some oceanographers still call it the “Arctic Sea”.
The Arctic Ocean is the most diverse in terms of fish species. It has a wide variety of marine species including whales, jellyfish, etc.
But because of its frigid temperatures, it has little plant life. This makes it one of the most fragile ecosystems on the planet.
The size of the oceans varies markedly, and when ranked from the largest to the smallest, the list is:
- Pacific (155,557,000 square kilometres)
- Atlantic (76,762,000 square kilometres)
- Indian (68,556,000 square kilometres)
- Southern (20,327,000 square kilometres)
- Arctic (14,056,000 square kilometres).
1 The Pacific Ocean
The Pacific Ocean is the largest ocean covering more than 30% of the Earth. This is close to half of the water on Earth.
It touches the west coast border of the Americas along with east Asia and Australia.
The equator divides the Pacific Ocean into two separate parts – North Pacific Ocean and South Pacific Ocean.
Pacific means “peaceful” in Latin. It has the deepest trenches with an average depth of 3800m.
2 The Atlantic Ocean
The Atlantic Ocean is situated between the Americas and European/African continents. Atlantic Ocean is the second largest and saltiest ocean in the world.
It resembles an S-shape between the Americas, Europe and Africa. “Atlantic” originated from the Greek god “Atlas” who carried the sky for eternity.
The ocean bottom is composed of mid-Atlantic Ridge. This submarine mountain range extends all the way from Iceland to 58 degrees South latitude. It’s part of the longest mountain range in the world.
The Vikings, Portuguese and Christopher Columbus have extensively explored the Atlantic Ocean. Similarly to this day, it’s being used for trade routes such as the transatlantic trade route.
3 The Indian Ocean
Indian Ocean is the third largest ocean surrounding a densely populated region. It contains additional 20% of water on Earth’s surface.
It borders India at the North, East Africa, Australia and the Southern Ocean. Because if higher water temperature, it has limited marine life.
It is bounded by 4 tectonics plate boundaries and may include an additional plate boundary.
4 The Southern Ocean
In 2000, the Southern Ocean is the newest ocean recognized by the International Hydrographic Organization. It borders Antarctica in its entirety.
In terms of size, it’s the fourth largest at 20,327,000 square kilometers. It extends out to 60 degrees South latitude.
It’s an extreme environment and is the least understood of the 5 oceans. This is because it is unexplored, far from populated areas and has a severe climate.
Despite the Southern Ocean being unexplored, about 80% of all oceans in the world are unexplored. There’s still a lot of work to do for ocean exploration.
5 The Arctic Ocean
Arctic Ocean is the world’s smallest and shallowest ocean of all 5 oceans. Further to this, it is the coldest and least salty ocean.
In size, the Arctic Ocean is about the size of Russia. Because it’s located at the North Pole, the Arctic Ocean has polar ice. But over the years, glaciers have melted threatening sea levels to rise.
Despite the IHO recognizing it as the “Arctic Ocean”, some oceanographers still call it the “Arctic Sea”.
The Arctic Ocean is the most diverse in terms of fish species. It has a wide variety of marine species including whales, jellyfish, etc.
But because of its frigid temperatures, it has little plant life. This makes it one of the most fragile ecosystems on the planet.
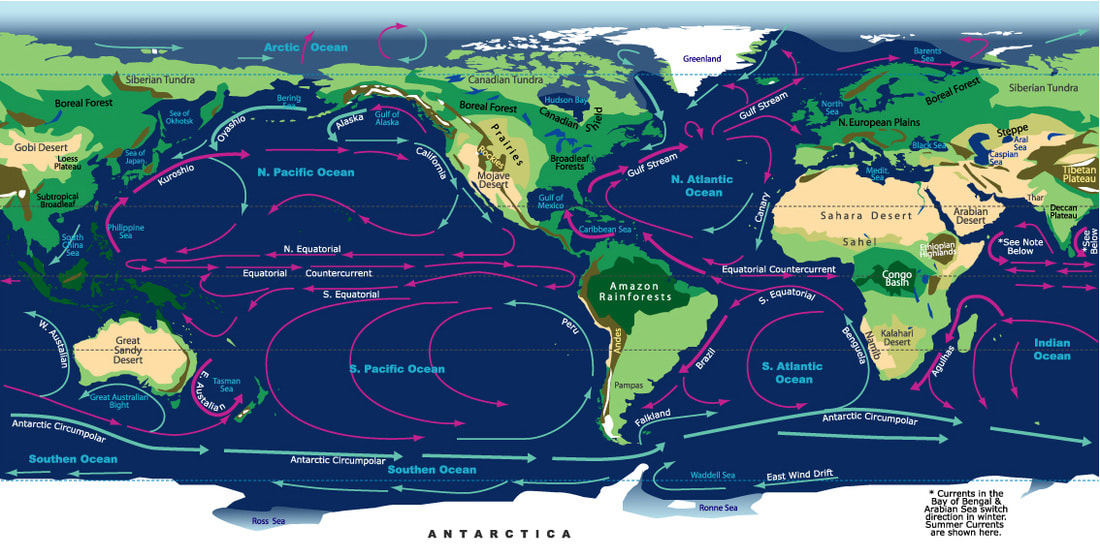
Ocean Currents (Blue=Cold & Red=Warm)
Factors that affect ocean currents
There are a variety of factors that affect how ocean currents (water in motion) are created, including a combination of two or more factors. The different types of currents (referred to as surface or thermohaline, depending on their depth) are created by, among other things, wind, water density, the topography of the ocean floor and the coriolis effect.
Wind
Wind is the single biggest factor in the creation of surface currents. Strong winds moving across an expanse of water move the surface of the water. These strong winds are not random breezes; the major winds that most often effect the creation of ocean currents are the Westerlies, which blow west to east, and the Trade Winds, which blow east to west.
Water Density
Another major factor in the creation of currents is water density, caused by the amount of salt in a body of water, and its temperature. Water with a higher salinity, or colder water, is more dense and likely to sink. Sinking water pushes the water below it up. The combination of sinking and rising in the same area causes a current.
Ocean Bottom Topography
Water contours to the topography of the ocean floor or bed. If the ocean bottom "drops out," like in a valley or trench, the moving water will move downward. If there is a rise in the ocean bottom, like a ridge or mountain, the water moving along it will be forced upward. The sudden upward or downward change of direction causes water displacement, creating a current.
Coriolis Effect
When a rotating object collides with another moving or stationery force, it creates a new motion. The Earth's rotation creates two currents: one, a clockwise movement of water in the Northern Hemisphere; the other, a counter-clockwise movement of water in the Southern hemisphere. When these currents are deflected by land masses, they create huge ocean currents called gyres.
|
Coastal currents are affected by local winds. Surface ocean currents, which occur on the open ocean, are driven by a complex global wind system.
If the Earth did not rotate and remained stationary, the atmosphere would circulate between the poles (high pressure areas) and the equator (a low pressure area) in a simple back-and-forth pattern. But because the Earth rotates, circulating air is deflected. Instead of circulating in a straight pattern, the air deflects toward the right in the Northern Hemisphere and toward the left in the Southern Hemisphere, resulting in curved paths. This deflection is called the Coriolis effect. It is named after the French mathematician Gaspard Gustave de Coriolis (1792-1843), who studied the transfer of energy in rotating systems like waterwheels. (Ross, 1995). Global winds drag on the water’s surface, causing it to move and build up in the direction that the wind is blowing. And just as the Coriolis effect deflects winds to the right in the Northern Hemisphere and to the left in the Southern Hemisphere, it also results in the deflection of major surface ocean currents to the right in the Northern Hemisphere (in a clockwise spiral) and to the left in the Southern Hemisphere (in a counter-clockwise spiral). These major spirals of ocean-circling currents are called “gyres” and occur north and south of the equator. They do not occur at the equator, where the Coriolis effect is not present (Ross, 1995). Ekman spiral The Ekman spiral, named after Swedish scientist Vagn Walfrid Ekman (1874-1954) who first theorized it in 1902, is a consequence of the Coriolis effect. When surface water molecules move by the force of the wind, they, in turn, drag deeper layers of water molecules below them. Each layer of water molecules is moved by friction from the shallower layer, and each deeper layer moves more slowly than the layer above it, until the movement ceases at a depth of about 100 meters (330 feet). Like the surface water, however, the deeper water is deflected by the Coriolis effect—to the right in the Northern Hemisphere and to the left in the Southern Hemisphere. As a result, each successively deeper layer of water moves more slowly to the right or left, creating a spiral effect. Because the deeper layers of water move more slowly than the shallower layers, they tend to “twist around” and flow opposite to the surface current. |
Coriolis force
Ekman spiral
|
Sea floor morphology
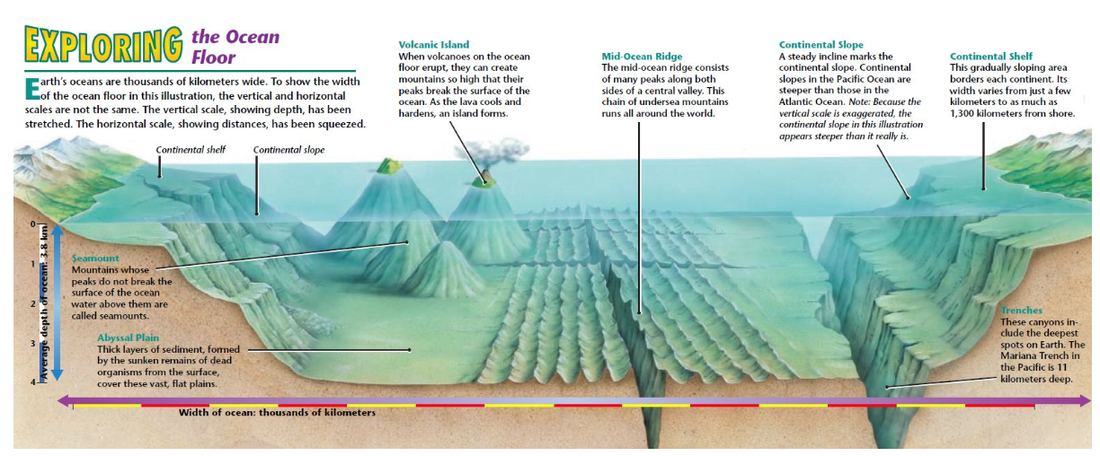
| sea_floor_morphology.pdf |
Oceanic Water
Averages
- Temperature: Below 1000m there is a uniform average of 2°C
- Salinity: 35 parts per thousand (ppt)
|
|
|

Using the next three diagrams.
|
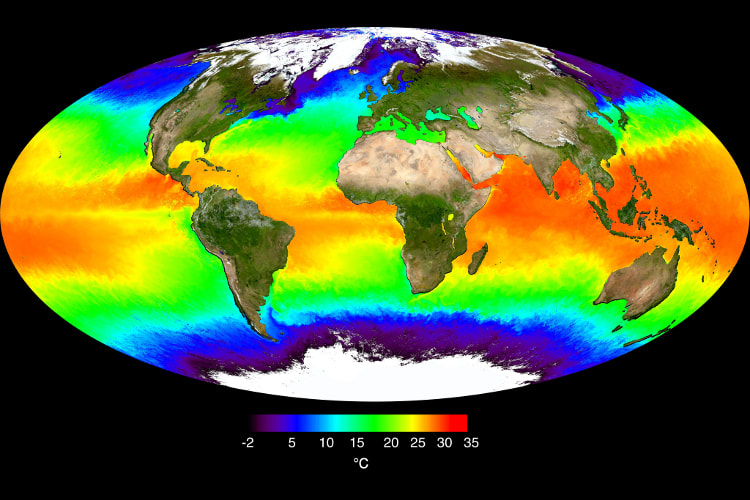
Sea surface temperatures
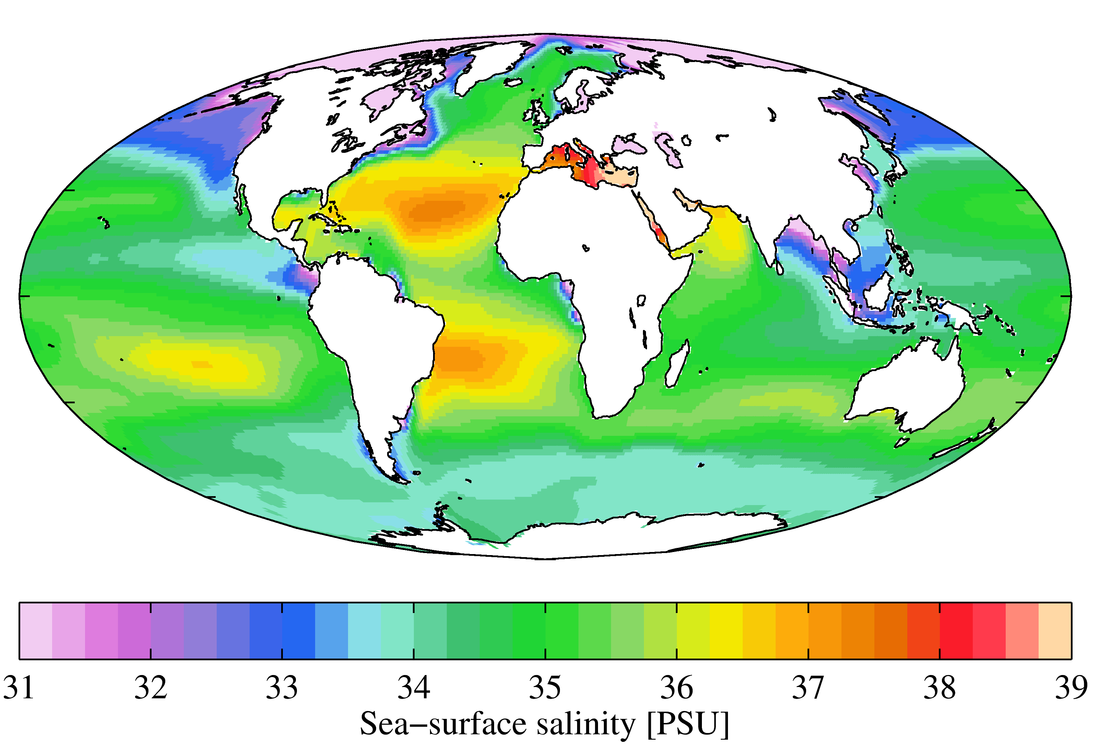
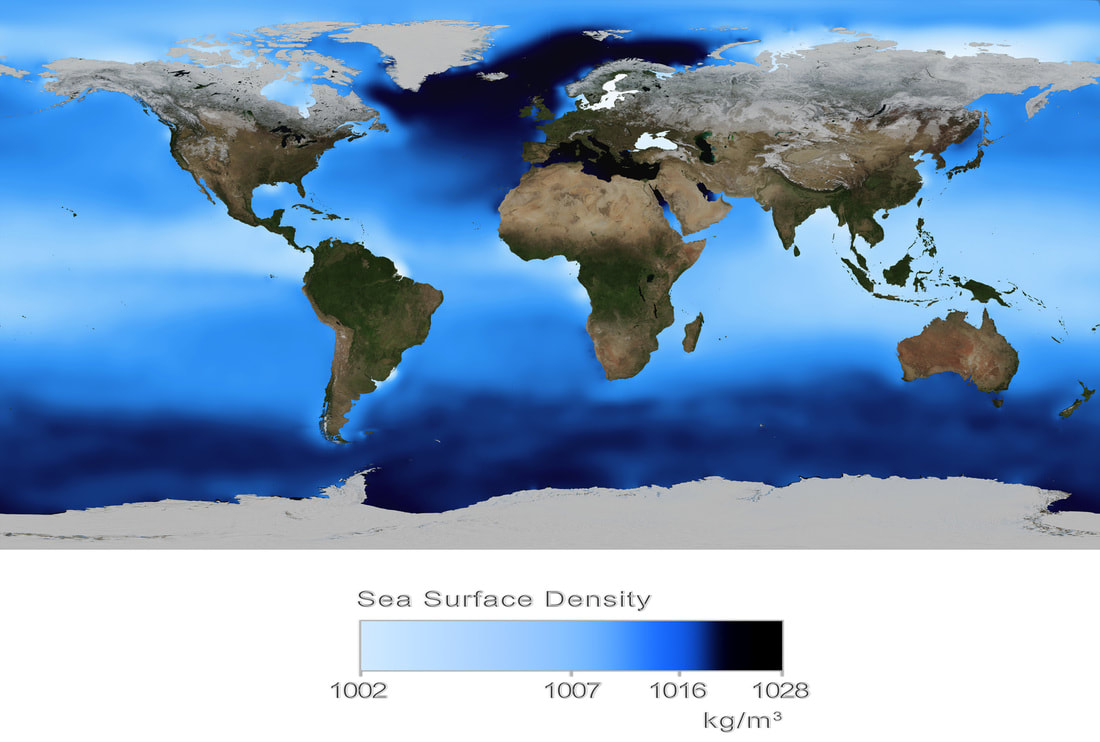
Sea surface salinity
|
Salinity and density show the opposite trend to water as the depth of ocean water increases. Temperature declines with increasing depth, but salinity and water density both increase. In the same way that temperature shows a rapid fall at the thermocline, salinity shows a rapid increase at about the same depth, which is referred to as the halocline. Because temperature declines as salinity increases, the net effect is to increase water density as depth increases. Because the thermocline and the halocline occur at about the same depth, the water density also increases most rapidly in the same zone, which can also be referred to as the pycnocline, which is defined the layer in the ocean where the water density increases rapidly with depth.
Codrington, Stephen. Our Planet's Oceans and Coasts (Planet Geography Book 5) . Solid Star Press. Kindle Edition.
Codrington, Stephen. Our Planet's Oceans and Coasts (Planet Geography Book 5) . Solid Star Press. Kindle Edition.

Comparing Thermocline, Halocline and Pycnocline
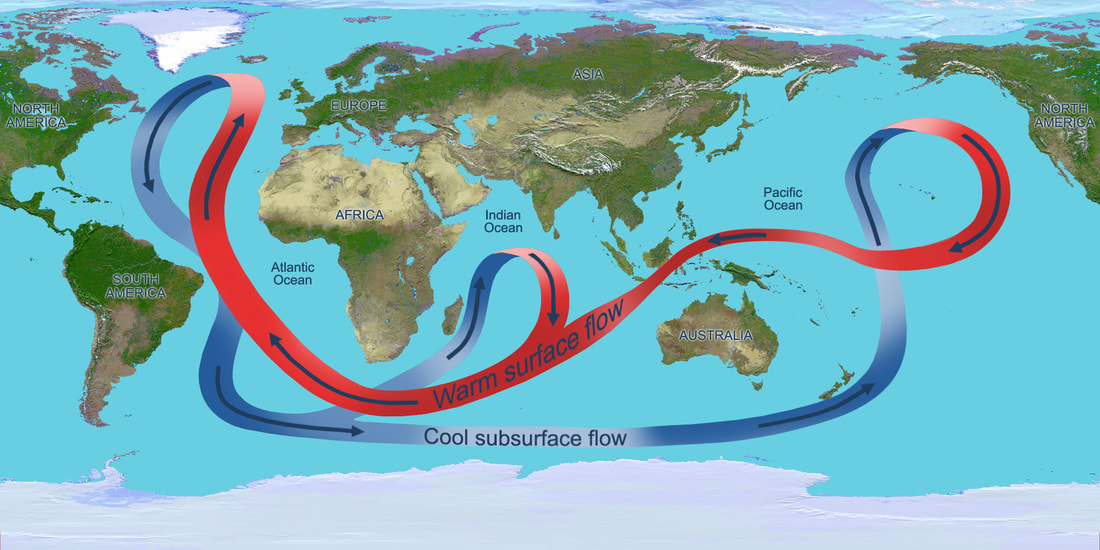
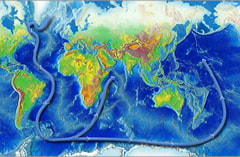
Ocean conveyor belts
|
Stage 1:
Cold, salty, dense water sinks at the Earth's northern polar region and heads south along the western Atlantic basin. |
Stage 2:
The current is "recharged" as it travels along the coast of Antarctica and picks up more cold, salty, dense water. |
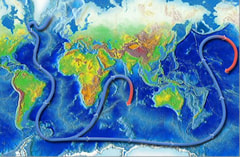
Stage 3:
The main current splits into two sections, one traveling northward into the Indian Ocean, while the other heads up into the western Pacific. |
Stage 4:
The two branches of the current warm and rise as they travel northward, then loop back around southward and westward. |
Stage 5:
The now-warmed surface waters continue circulating around the globe. They eventually return to the North Atlantic where the cycle begins again. |
|
|
|
|

|
|
|
The Nutrient cycle
EL Nino Southern OSCILLATION (ENSO)
| El Nino 2015-2016 Geofile |
|
|
|
|

El Nino Impacts on the world
Ocean carbon store
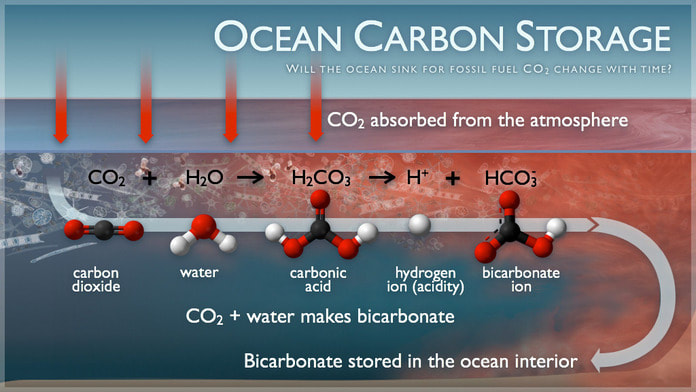
Ocean carbon storage
|
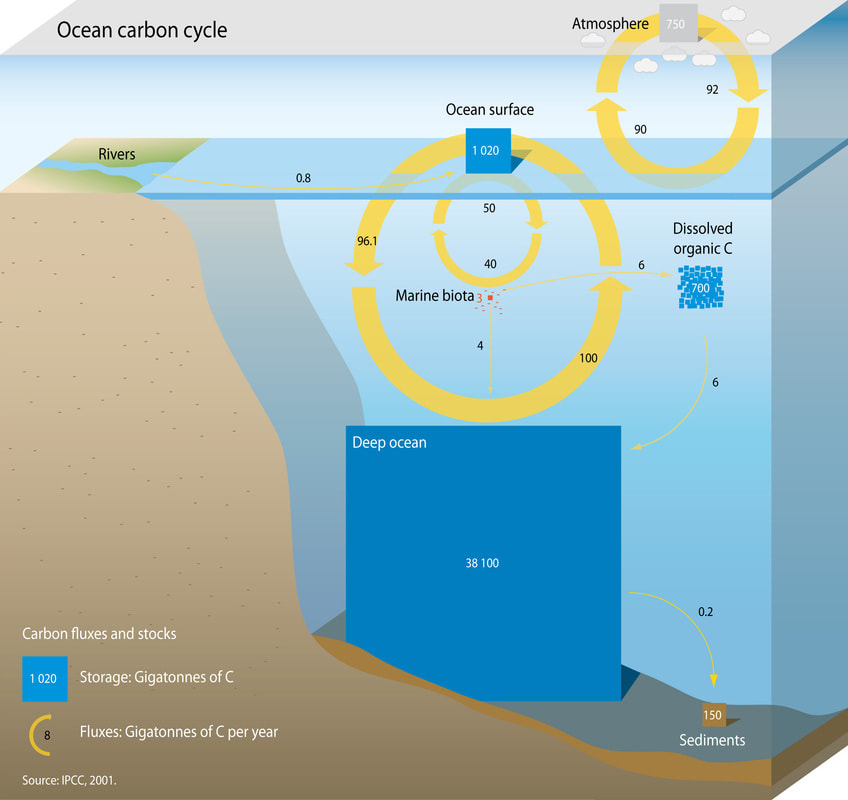
The ocean dominates the earth's carbon cycle. Half the photosynthesis (primary productivity) on earth takes place in the sunlit layers of the ocean and the ocean absorbs half of all carbon dioxide added to the atmosphere.
The ocean is what we call a carbon sink - actually the largest carbon sink on earth! That means it stores carbon. |
Oceans are 'soaking up less CO2'
The amount of carbon dioxide being absorbed by the world's oceans has reduced, scientists have said.University of East Anglia researchers gauged CO2 absorption through more than 90,000 measurements from merchant ships equipped with automatic instruments.
Results of their 10-year study in the North Atlantic show CO2 uptake halved between the mid-90s and 2000 to 2005.
Scientists believe global warming might get worse if the oceans soak up less of the greenhouse gas.
Researchers said the findings, published in a paper for the Journal of Geophysical Research, were surprising and worrying because there were grounds for believing that, in time, the ocean might become saturated with our emissions.
'Saturated' ocean
BBC environment analyst Roger Harrabin said: "The researchers don't know if the change is due to climate change or to natural variations.
"But they say it is a tremendous surprise and very worrying because there were grounds for believing that in time the ocean might become 'saturated' with our emissions - unable to soak up any more."
He said that would "leave all our emissions to warm the atmosphere".
Of all the CO2 emitted into the atmosphere, only half of it stays there; the rest goes into carbon sinks.
There are two major carbon sinks in the biological cycle: the oceans and the land "biosphere", which includes plants and the soil.
|
|
|
|
Tropical storms - Hurricanes, Cyclones & Typhoons
Hurricanes: A hurricane is a large low pressure system characterised by high winds and heavy rain. Hurricanes are also known as typhoons in East and South-east Asia and cyclones around the Indian Ocean. To be classified as a hurricane, winds must exceed 119km/hr (74 mph). Small low pressure systems are called tropical storms (63-118km/hr) and tropical depressions (0-62km/hr).
| hurricanes.pdf |
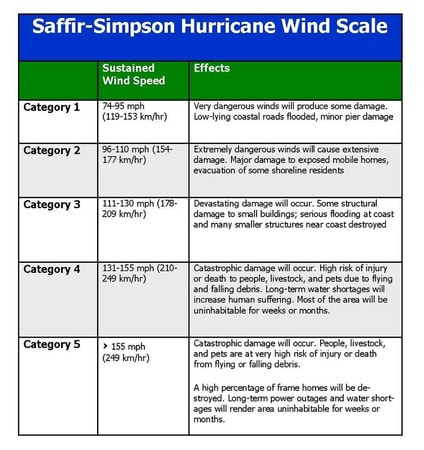
Saffir-Simpson Hurricane Scale
|
|
Hurricanes are normally measured by using the Saffir-Simpson Hurricane Scale developed by the National Oceanic and Atmospheric Administration. Hurricanes are measured on a scale of 1-5 depending on their wind speed and storm surge.
However, it must be noted that category five storms don't always cause the most damage. The amount of damage caused by hurricanes can depend on a number of factors including:
However, it must be noted that category five storms don't always cause the most damage. The amount of damage caused by hurricanes can depend on a number of factors including:
- Where landfall is (populated or non-populated area)
- The development of the country
- The warning given to residents and the preparedness of residents.
- The existing conditions (saturated ground or not)
- The timing of landfall (high tide or low tide)
|
|
|
| 162_huricanes-predictable_hazard.pdf |

Complete all questions on the following worksheet
| |||

Hurricane Katrina 2012
|
| ||||
